All workstations have bottlenecks that slow you down, but do you know where they are? Greg Corke shares some tips to help you identify the components in question and get the most out of your workstation budget
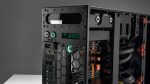
For architects, engineers and product designers the workstation is an essential piece of equipment. But for many it’s just a black box that sits under the desk. Very little attention is paid to the components inside, and when things slow down it’s the ‘bloody workstation’ that gets both barrels, rather than the CPU, GPU, memory or storage.
It can pay dividends to discover when and where your bottlenecks are occurring. It can help you understand where to best allocate your workstation budget or how a simple upgrade or a change in behaviour could boost performance. And key to this, is knowing how the software you use every day actually works.
This is a lot easier than it might sound and there are some simple tools that can help you. Some are built into Windows; others are freely downloadable. Many of the major workstation manufacturers including Dell, HP and Lenovo also offer their own utilities.
At AEC Magazine we regularly use Windows Task Manager (right-click the Taskbar and click Task Manager), GPU-Z and CPU-Z. These give you real time feedback on how each workstation component is being stressed at any point in time. For longer term monitoring, there’s also Windows Performance Monitor (type ‘perf’ into Windows search and click the result).
Memory
One of the first and easiest things to check is system memory. When it becomes full, the workstation slows down because applications have to fall back to permanent storage – Solid State Drive (SSD) or Hard Disk Drive (HDD) – which is much slower.
These days we use multiple applications with huge datasets. Even simple Office applications can use crazy amounts of memory. If your memory regularly becomes full, either limit the number of applications you keep open or get a memory upgrade. Memory is very easy to fit.
With compute intensive software, including simulation and point cloud processing, memory usage can go up and down over a long period of time. Windows Performance Monitor is a great way of tracking this without staring at your screen for hours on end.
CPU
The main thing to look out for with CPUs is core utilisation. i.e. how many CPU cores your software uses. If it uses one core the software is single threaded, and the bottleneck is likely to be CPU frequency. If it uses lots of cores the software is multi-threaded, and it may then benefit from a CPU with more cores.
Even though modern workstation CPUs feature a minimum of six or eight cores, a lot of software still can’t take advantage. Most CAD software, for example, is singlethreaded, although there can be certain processes within it that are multithreaded.
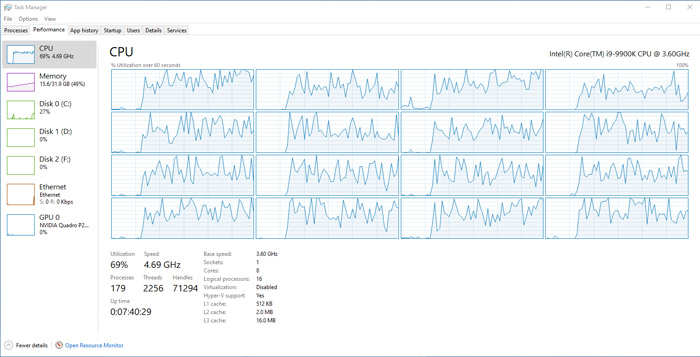
It’s relatively easy to track core utilisation in Task Manager as there’s a graph for each logical processor – both the physical core and the virtual core (enabled through Intel HyperThreading (HT) or AMD Simultaneous multithreading (SMT)). However, as the charts in Task Manager show CPU utilisation within the entire workstation (including operating system, background operations and graphics drivers etc.) it’s important to make sure your workstation is only doing one thing at a time. Closing other applications certainly helps.
CPU rendering software is extremely good at utilising multiple CPU cores so will devour all the processing power you throw at it. However, this isn’t true for most other multi-threaded software. Some point cloud processing, simulation and CAM applications for example, only use a few cores. Others use around a dozen or more. Only a few applications will benefit from virtual cores (SMT or HT). Core utilisation can also vary by dataset and available system memory.
Task Manager is a good starting point for finding out exactly how many cores your software uses. It’s usually quite easy to see if the software is single or multithreaded. And with rendering software, all cores will generally be at 100%. However, things get more complicated with other multi-threaded software.
Too many cooks can certainly spoil the broth, so even if Task Manager shows lots of cores in use, the software won’t necessary be using them efficiently. In some cases, the software might actually run faster on a workstation with fewer cores. To get to the nitty gritty you really need to do some benchmarks, testing with different numbers of cores, by disabling them in the BIOS.
Keeping track of CPU frequency is also very important. All modern CPUs feature some kind of ‘boost’ that increases the frequency of one or more cores above the base clock speed. This is done wherever possible, so long as the CPU stays within its power and temperature limits.
Boost speeds can vary dramatically which can have a huge impact on performance. In general, in single threaded workflows, the CPU should hit or get close to its top advertised Turbo frequency. In multi-threaded workflows it usually sits somewhere between the base and Turbo.
When a CPU gets really hot it can even be throttled so it goes below the base frequency. If this happens you can really feel the workstation slow down.
To observe CPU frequency simply use Task Manager or CPU-Z. If it’s lower than expected, first check out Windows Power Options and see if selecting a highperformance power plan makes any difference. If it doesn’t, then it could be that a heatsink or fan is covered in dust, or vents are blocked, which makes the CPU harder to cool. This can be a particular problem with mobile workstations where the CPU is crammed into a small space. However, if you are experiencing throttling because of overheating, you’ll probably also notice excessive noise as the fans will already be working overtime. Here, a quick clean can sometimes do wonders. Alternatively, simply make sure your machine has enough ventilation, especially in hot weather. Those who are more technical could also upgrade the cooling system.
Sometimes frequencies can drop over a longer period of time, say when ray trace rendering. Frequencies might start off high but then slow down after a few minutes when the CPU heats up. Performance Monitor is a good way to track this.
Mobile workstation CPUs can also slow down when running off battery, simply because they can’t get enough power. You may be surprised at how much slower a mobile workstation runs when it’s not plugged in, which will make you think twice about where and how you work.
Frequency variations are not limited to the CPU. Graphics Processing Units (GPUs) can also experience the same issues and this can be tracked through GPU-Z or Performance Monitor.
GPU
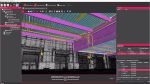
For the GPU, utilisation and memory usage are the main things to look out for. For any 3D application, load up your largest dataset, turn on your common viewing modes, then move the model around the viewport. It’s important to do this ‘full screen’ as when the application is Windowed it typically uses less resources. To stop Task Manager becoming hidden behind your 3D application, click options > Always on Top. You can do similar in GPU-Z.
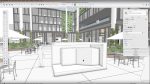
If GPU utilisation hits 100%, as it will likely do in any real time viz, VR or GPU rendering application, then you can be fairly certain that the GPU is causing the bottleneck. Here, upgrading to a more powerful GPU will increase 3D performance or reduce render time. However, if GPU utilisation is very low – as it often is in CPU limited CAD and BIM applications like Autodesk Inventor or Autodesk Revit, then it’s quite likely that the bottleneck is in the CPU and there would be little to no benefit to upgrading to a more powerful GPU. In such cases, the best way to increase 3D performance would be with a higher frequency CPU.
For CAD, GPU memory typically isn’t a bottleneck, especially with newer professional graphics cards, although anything under 4GB can cause problems with larger models. But, with the rise in real time viz, GPU rendering and VR, memory demands have grown. And if you do run out of GPU memory, things can really slow down, or sometimes even crash.
For real time 3D applications there is a little bit of leeway. Some GPU rendering tools also support ‘out of core’ where some of the memory from the GPU is offloaded to the main system RAM. Generally speaking, however, if you regularly push the memory limits, you’ll likely benefit from a GPU with more memory. However, unlike system memory, it’s not possible to upgrade GPU memory. You have to upgrade the entire GPU.
Getting a better understanding of GPU memory usage can be really important in making the best decisions. For example, there are a wide variety of 8GB professional GPUs out there and while some offer a huge upgrade in terms of raw performance, you may still experience a bottleneck unless you go up to 16GB.
One final mention should go to mobile workstations. If you’re experiencing really poor 3D performance, it could be that the software is using the wrong GPU. Most mobile workstations offer switchable graphics which is designed to use the high performance Nvidia Quadro or AMD Radeon Pro GPU for 3D applications, and Intel integrated graphics for less demanding tasks. However, sometimes it gets muddled up. A quick look at GPU-Z will show which GPU is in use and change settings accordingly. Sometimes switchable graphics needs to be disabled in the BIOS.
Storage
Task Manager and Performance Monitor include several tools for tracking disk performance and activity but generally the best way to identify storage bottlenecks is through real world benchmarking. i.e. testing different drives to see how long it takes to complete tasks such as opening or processing datasets or booting up Windows and launching applications.
Synthetic benchmarks, such as CrystalDiskMark, which measure sequential or random read / write performance, only really tell you part of the story, so don’t be seduced by numbers on charts. Most operations also involve some form of processing and disk activity may only contribute to a relatively small part of the overall time. When it comes to opening a CAD assembly, for example, a fast Solid State Drive (SSD), is hardly any quicker than a slow Hard Disk Drive (SSD).
Disk performance becomes more important when working with huge multi GB datasets used in point cloud processing, simulation or 8K video editing. It becomes even more critical when system memory is in short supply.
Of course, disk performance is not just important for tasks that take seconds, minutes or hours. Responsiveness is very important, as is the ability to read data from and write data to multiple sources at the same time. This is why you should absolutely not be using a rotating HDD as the system drive in your workstation. As SSDs are now so cheap these days, it’s a bottleneck no one should have to endure.
Conclusion
Understanding where your bottlenecks occur can help ensure you get the most out of your workstation budget. Over the years we’ve heard several examples of money being thrown down the drain with firms investing in multi-core CPUs or high-end GPUs to ‘speed up’ CAD.
While some software companies publish recommended workstation specifications, these tend to be base level and, because of fast changing hardware, not always up to date. In addition, as everyone’s datasets are different, ‘one size fits all advice’ doesn’t really exist. We’ve also seen cases where technical reality is distorted by marketing ambition.
There are many ways you can identify bottlenecks in your workstation beyond those noted in this article, but hopefully this gives a good starting point. We all want our workstations to go faster as it can have a huge impact on productivity. And if it can also help keep profanities at bay, then that’s no bad thing.
If you enjoyed this article, subscribe to our email newsletter or print / PDF magazine for FREE
https://aecmag.com/administrator/index.php?option=com_content&view=article&layout=edit&id=1966#