BIM is not just about modelling to get drawings, it’s about modelling to create building information. The problem is, the data comes from multiple sources, can be ‘noisy’, conflicting and suffer epic quality failures. New American start-up Toric enables users to integrate, transform, visualise and automate project data
While drawings are symbolic representation of a design, Building Information Modelling – (BIM) software opened up the opportunity to embed all sorts of useful information regarding the components, the materials, the serviceable items within the evolving design data.
For many reasons, the digitisation of the design and construction market is still a black art and tough to keep on top of inside one company, but as most projects involve 25 or more companies creating data in multiple applications, what should be structured data can quickly turn into chaos.
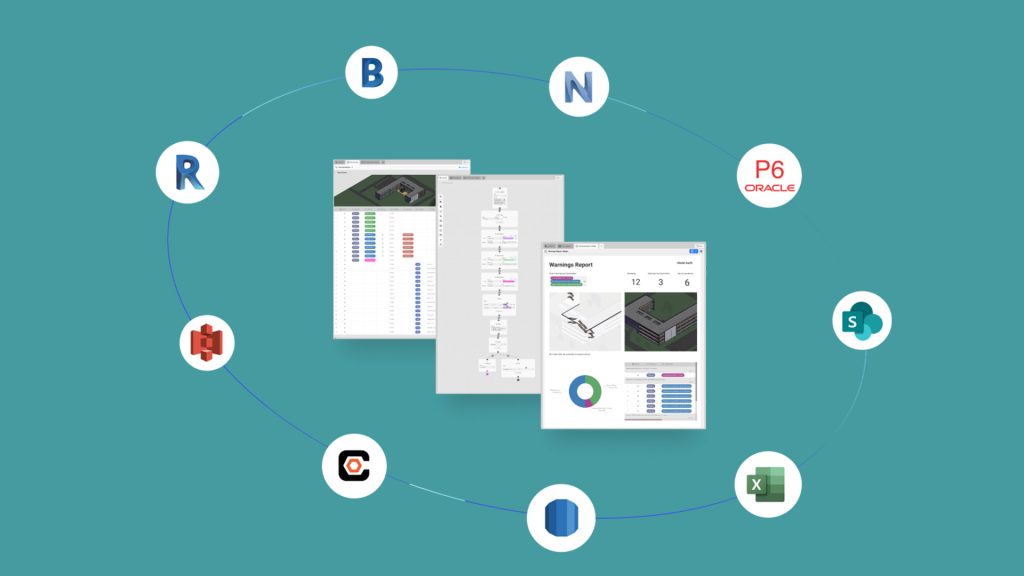
Toric is a cloud-based construction analytics platform which can access construction data from over 20 applications – CAD, BIM, CSV, SaaS services, project management, 4D sequencing and accounting and juggle, filter and merge to create real-time data pipelines.
All this data can be displayed on custom dashboards and created reports. In short, it’s an ELT platform- it Extracts the data, Loads the data and Transforms it. It’s capable of making sense of all the distributed data that is generated by a project, and then can be used to apply data transforms to serve up essential project metrics.
The Toric service was the brain-child of Thiago Da Costa, a serial entrepreneur, who has sold at least two companies to Autodesk over the years. With his last sale, Lagoa, a cloud-based 3D mechanical collaboration and visualisation company, Da Costa stayed on at Autodesk to work on the company’s cloud-based solid modelling tool, Fusion, for five years, being the company’s director of data.
After getting itchy feet and having never been directly involved in construction (but having an interest in it) Da Costa decided to go into building development. He brought his uncle out of retirement to help him build a twenty-unit apartment block. The experience did not follow the BIM utopia that he was used to hearing about at Autodesk, especially when project data was mainly held in spreadsheets, which were almost always out of date, as Da Costa explains, “It was not uncommon to spend an entire design review session trying to find out why a change was made, who made it, and if it was agreed upon or not.”
In short, he saw data problems everywhere and the project was completed six months late and 10% over budget. Da Costa saw a problem that needed solving and so started to develop Toric. “I started talking to construction companies all over the world to understand their pain points with data,” he explains. “I learned that spreadsheets are indeed what runs most of all professional construction projects. Even companies running $100M+ projects are still relying heavily on them for all kinds of problems. It is not uncommon to see spreadsheets with 100+ tabs. Companies report that 60% of the time is spent chasing data they don’t trust or cleaning up data before it’s ready to be used.”
The net result was an 18-month stealth project to flesh out a system to try and automate the collection and filter of fragmented design and construction data, to automate user-defined data workflows. Toric has a rather unique take on the common data environment and is a bit of a Swiss Army knife in terms of data analytics.
The data warehouse
Think of Toric as a warehouse of data, it’s a service that can suck in the data from all the most used applications in the AEC market. Each connection is called an integration, should that be to Autodesk BIM 360, Procore, Revit, Archicad, Google Sheets, Salesforce, Navisworks etc.
It has the ability to bring in data from multiple systems and blend them together using templated (or user defined) workflows to reorganise and filter the data to give project teams insights from data analytics intelligence algorithms. This produces insights into all sorts of things. What’s wrong with a project’s data? How much does something cost? What are the quantities? What’s the carbon implication? And many more. While this sounds incredibly complex, the interface of Toric is very simple and crafting your own data workflows is very similar to Grasshopper’s ‘box and cable’ graphical interface but there are a whole load of templates that already come with it.
Toric certainly destroys the idea that the industry should be trying to shoehorn as much data into the BIM model as possible. Distributed project information need not be a problem and allows the best tool to be used for each part of the design and construction process
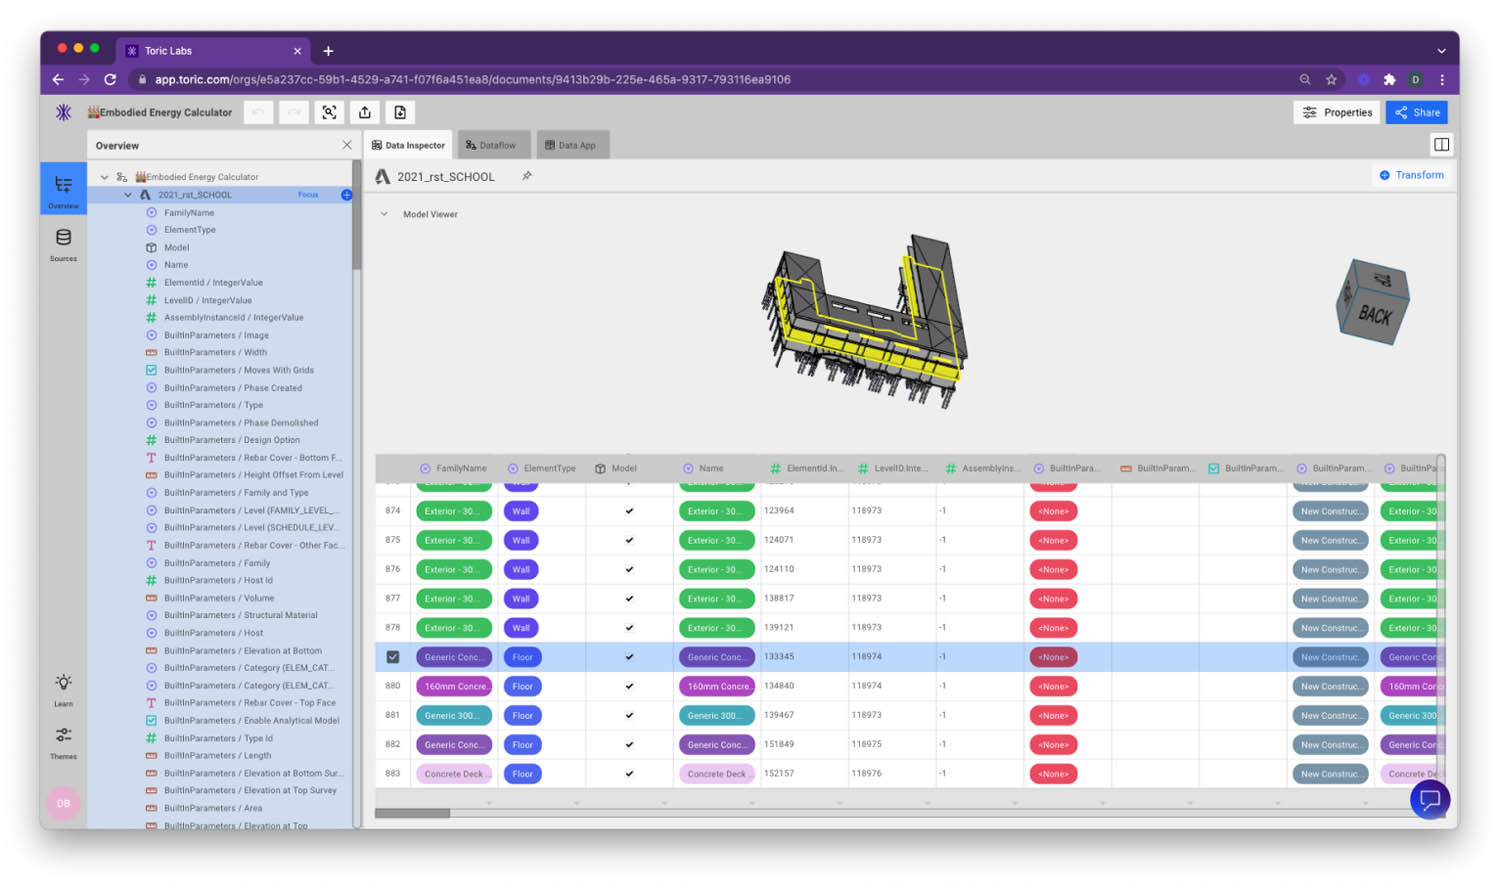
Toric has an innate understanding of the structure of each construction format and can link up the corresponding data inputs. While a lot of this is in spreadsheet format, with columns and rows, the software also has a display window to graphically see design geometry, linked to the spreadsheet data.
Mini transformations can be applied to help sort this data, such as by element (walls, doors windows, etc.), spaces, and get summaries. This could be used to count all the instances of one type of light in a project, or to get summaries of floor areas / usage. Toric takes the data, ‘normalises it’ and then derives reports from end user run queries. Results can be numerical or displayed graphically, such as by pie chart.
An example could be that Toric is fed the data from a project being run on the Procore construction platform and the user wants to see how much the project spend was on openings and interior finishes. This whole report can be fully automated in Toric.
The product would pull the quantities data continuously from Procore and ingest it, along with a pricing data and, through a user-defined pipeline, it would summarise the spend data and could produce a live report with a number of ways to visualise it.
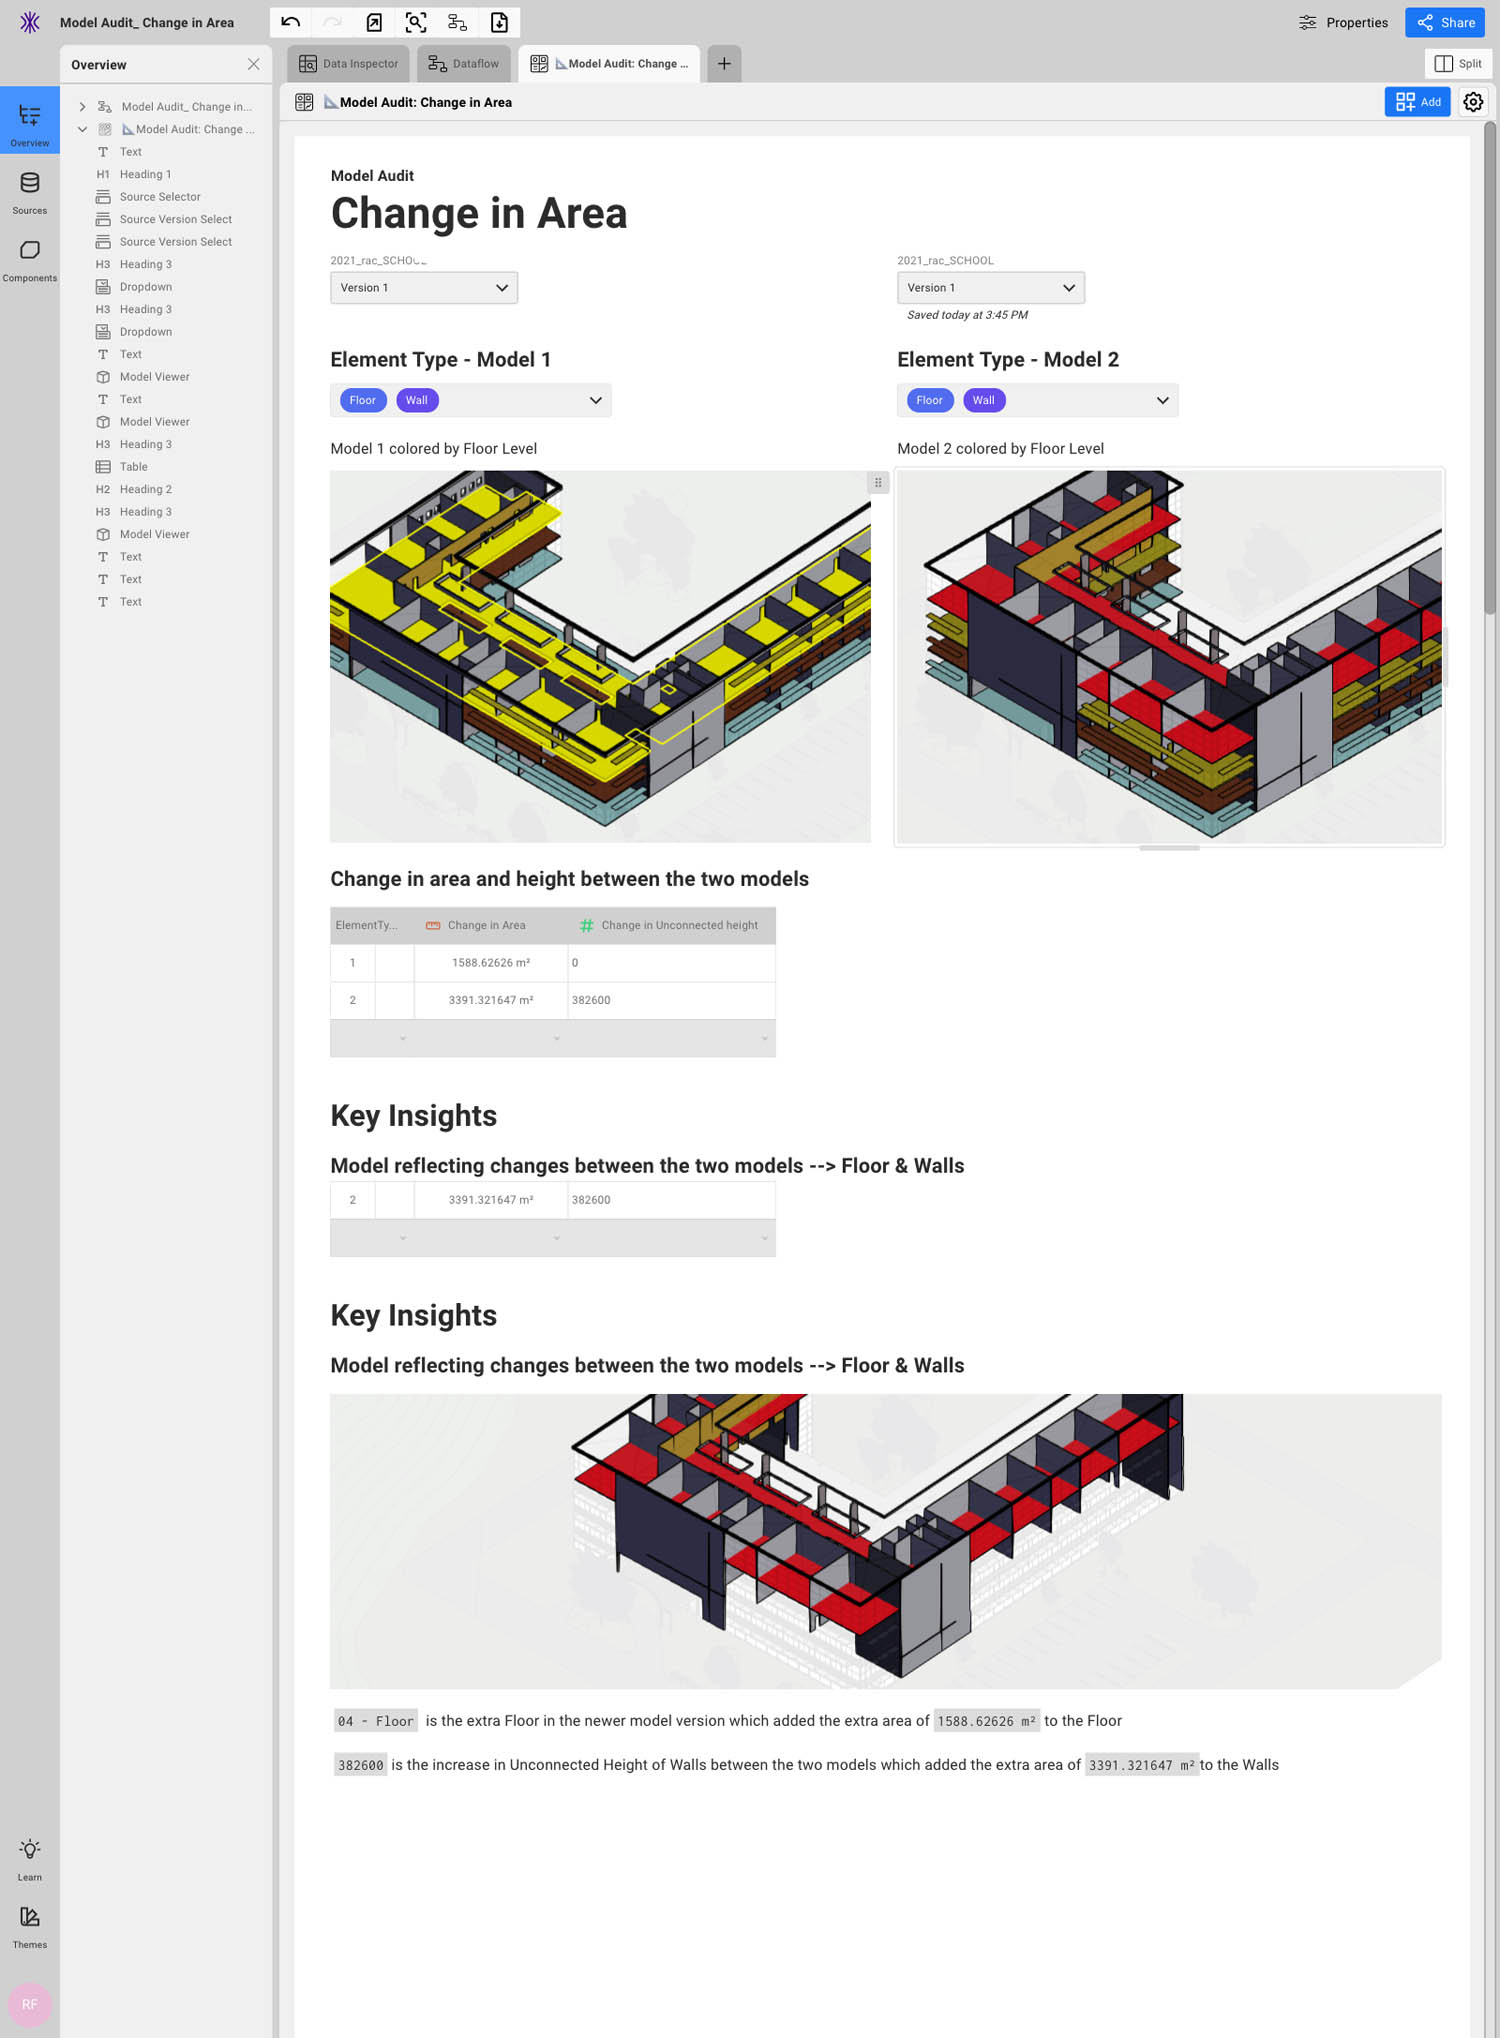
Alternatively in the design phase, Toric could compare two versions of variations of a building design. It would ingest the BIM files and calculate the quantities and cost providing the cost difference between the two, as Toric found the area had changed and there were more walls.
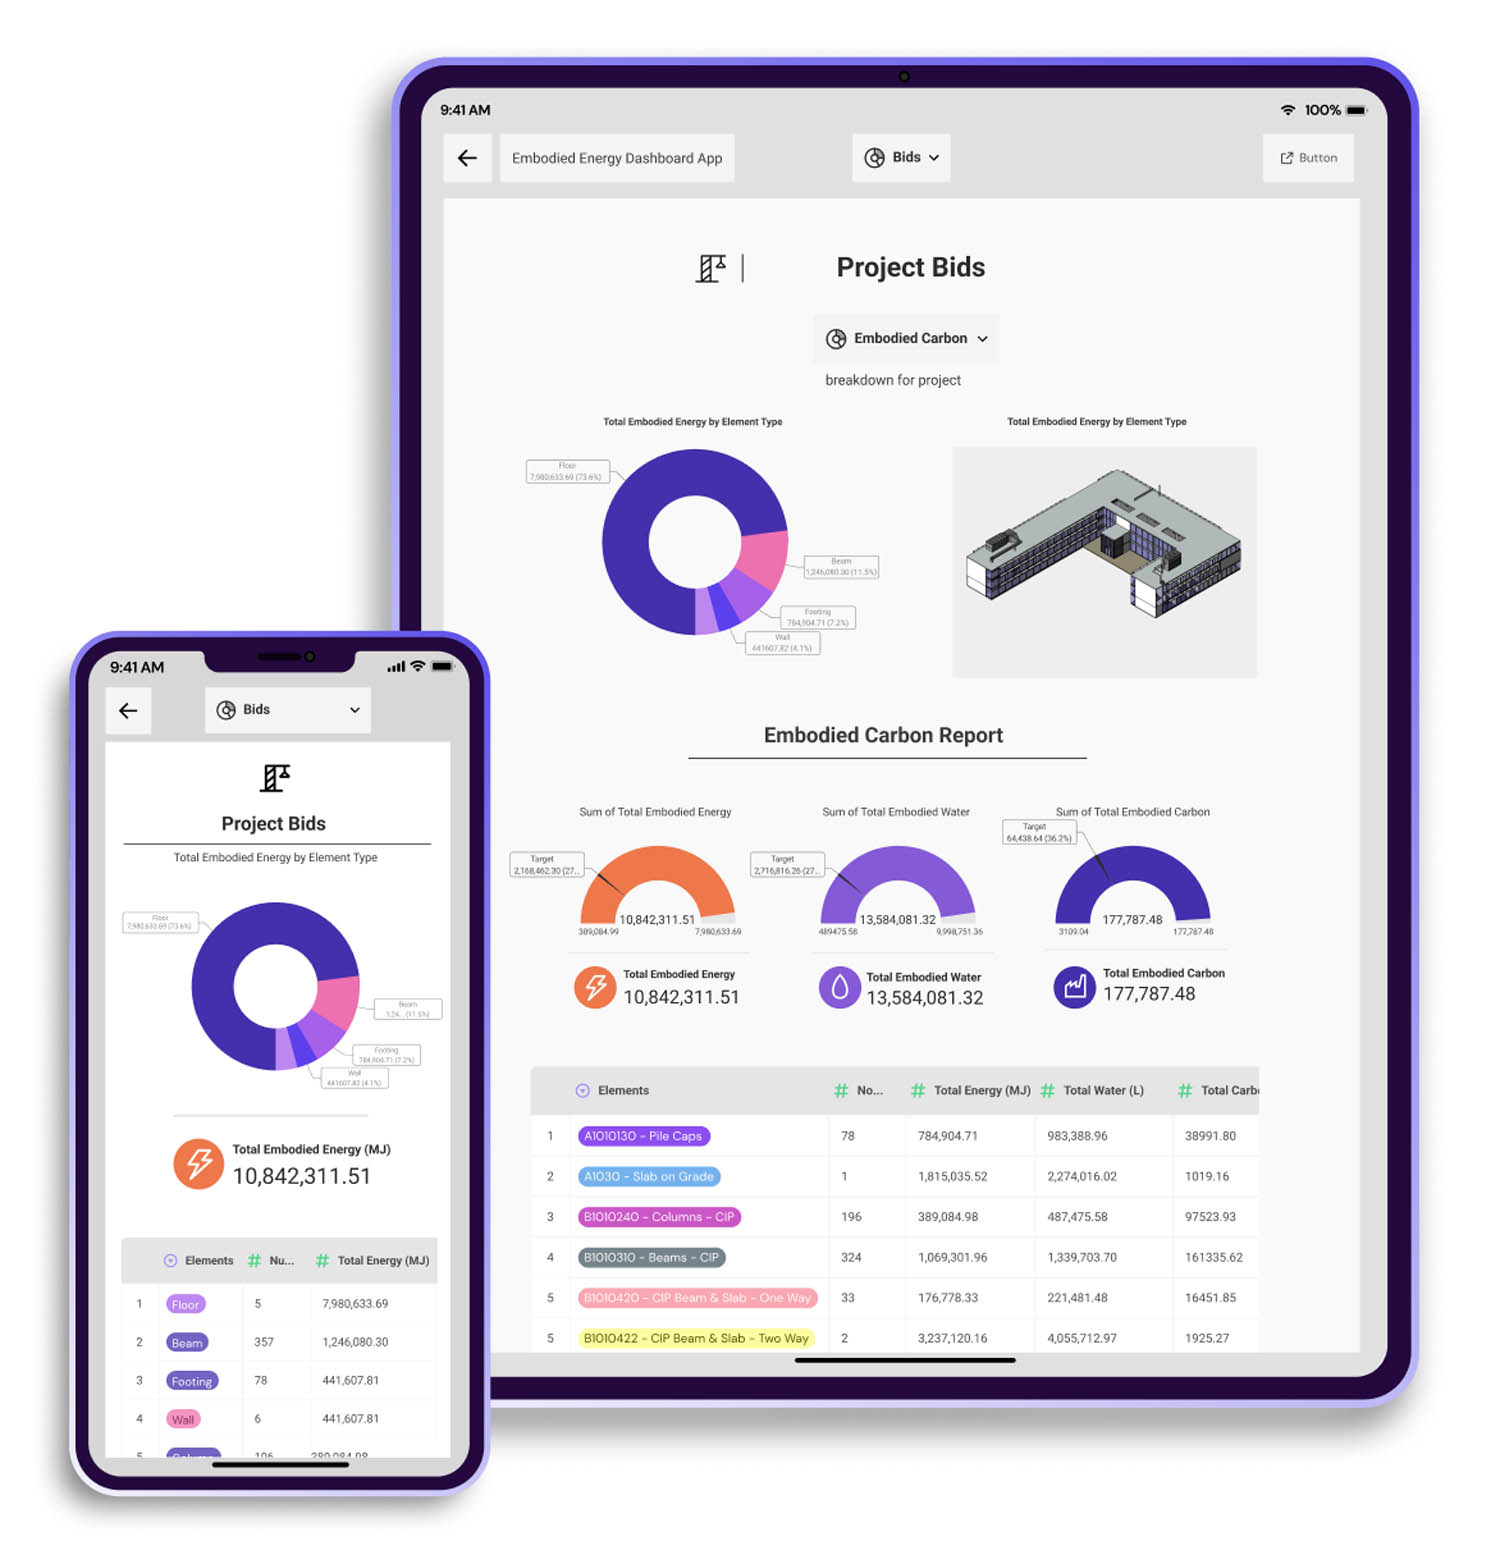
“What we see a lot of people want to do is quantify, to control quality, and integrate data, these are the top three things”, explains Da Costa. “There’s also the ability to warehouse data, which is a real powerful thing. Architects are increasingly interested in getting embodied carbon reports and they need to calculate the amount of concrete used in the entire model.
“The user just assigns a carbon value and Toric can go through the model, find all the concrete and then calculate, by volume, how much carbon. This is really useful in the design phase and a lot of our customers are doing that and they want to do that at scale.
“Basically, every time a model is changed, they want to see how how that carbon variable changed. The alternative to Toric at that point is to dump out an Excel file, do the calculations, and then go back to the model, change the model… and then do that whole process again… dump out the Excel file, redo all the calculations to build a report.
“An architect could spend a week or two to just figuring out the carbon thing. We have a template already that just does that – takes the model and spits out all the quantities for all the materials.”
Toric comes with dozens of built-in templates for setting up common dataflows, from clash detection to model audits, and more are being added all the time. But the user can create their own templates, which can obviously be used time after time. The software offers hundreds of data tools like data remapping, ‘find and replace’ filtering, grouping, sorting, summarising – everything you would imagine you can do to a database, plus there’s a bunch more.
Conclusion
For people that understand the problems that bad data causes in construction, Toric will immediately seem like an incredibly useful tool to have access to and to apply liberally, developing their own templates. For those that don’t have a data-centric view of BIM, the business and project metrics Toric is going to provide will seem like it was conjured up by wizards.
Toric certainly destroys the idea that the industry should be trying to shoehorn as much data into the BIM model as possible. Distributed project information need not be a problem and allows the best tool to be used for each part of the design and construction process. Talking with Da Costa, he explained why he thought products like Toric were important, “You need to use some tool because otherwise you’re not assisted by the computer, you’re literally doing the work that the computer should be doing.
“It baffles me that a lot of people are not realising that their BIM model quality is bad. If you have a typewriter, it doesn’t mean what comes out of it will be good, if you don’t have any kind of review of what gets written, if you have to review 200 sheets of PDF, it’s going to be awful, because you’re not going to be able, as a human, to optically distinguish every error that there is in those PDFs. And that’s where the industry is. It’s fascinating, why isn’t the model quality better? Why do people have to fix things at the PDF stage? Because nobody saw it in the BIM model! And now opening that BIM model is a pain, because the team already moved to another project.”