In the latest of his series of articles on Autodesk Revit, CADline’s Paul Woddy looks at how Revit’s powerful scheduling functionality can be extended, with the use of additional parameters, to enable it to count more effectively.
It is commonly known that in concept development work and early communication of design intent, Revit is pretty much in a class of its own for speed, efficiency and quality. Revit is able to make such a dramatic difference in these areas due to the Single Building Modelling approach to compile the data. Like all SBM software however, larger and more complex buildings cannot be modelled to a very fine level of detail, which is sometimes seen as a weak point. This leads to a number of interesting discussions during the adoption of Revit and whilst implementation specialists can give advice and the benefit of experience, it is very much an individual choice as to how to adapt the working processes to suit the new technology. How to re-organise your design team to maximise the efficiency with available skills and personnel, through to when to switch from 3D modelling to 2D draughting are all topics that need to be covered during implementation and deployment, but the subject of this article is how to use Revit to count.
The idea of taking all of this modelled information through to some kind of cost estimation software is an ideal which is a developing market. As Revit utilises object based data collation with unique element IDs for each object, it would make sense to assign a cost to these objects and hence define an overall cost for the project.
On the surface, a potential problem with this is that if we have moved away from the SBM approach of defining everything in 3D to a fine level of detail for the sake of efficiency, then we have broken the integrity of the object data.
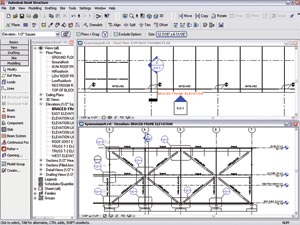
The way that Revit defines a wall style is by looking at the thicknesses of the various materials in the composition and ignoring the arrangement or structure, integral to that layer of material. By this I mean that a timber stud partition is defined as Plasterboard – Studwork – Plasterboard, regardless of the spacing of the timber studs. This extra information is added by means of a text note and if needed can be defined on elevation using simple linework. In the example shown in Figure 1, we have a thickness of brickwork forming the fa?ade of this cavity wall.
Revit will provide the volume, surface area and length of each wall defined in the model but will not by default break this down further into the quantity of brickwork required. For this we need to use the power of scheduling and formulae to extrapolate the data we need.
Firstly, we need to define parameters that will add value to the wall style. The standard parameter lists for all objects can be enhanced to include any information which we require for downstream application. The values entered into these parameters can therefore be used to drive formulae or even produce self-annotating objects. In this instance parameters for the percentages of brick and block have been added to the wall category. For each wall style the calculated values are entered and once done, the resulting toolbox of styles will form the basis for all projects.
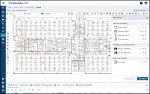
These values are all that is required in order to extrapolate all the data we need. When compiling our schedule, we can extract the identity data assigned to each wall and augment this information with derived values. See Figure 2.
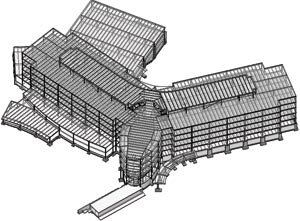
The volume of wall multiplied by the new parameter value for Brick Percentage will give us the volume of brickwork. Divide this value by the size of a brick and allowing for the mortar, we have the number of bricks. Furthermore, the values of volume, area and length can be used to obtain quantities of membrane, wall ties, insulation etc. See Figure 3.
Further examples of using additional parameters to make schedules more useful involve such things as radiators that have an assigned value for Watts per surface area and hence provide a total heat output based on the bespoke size defined by the designer. More simply, electrical sockets that know which ring main they belong to or light fittings with a defined switch number.
This approach does not suit every practice or project but the principles can be adapted to an unlimited variety of situations and give an insight into the power of the SBM data over and above the primary deliverable of draughting information.