Arnaud Girin, CFD application engineer at SimScale explores pedestrian wind comfort through the practical application of CFD technology on two real world projects
Every new building, especially a skyscraper, can have an impact on the surrounding environment, creating new microclimates that affect pedestrian safety and comfort.
Factors that dictate the outdoor climate include wind direction, wind speed, radiation and air pollution; all of which can be modified by the rise of a new building and its interaction with surrounding elements—other buildings or trees, for example. Depending on these elements, as well as the size, form, height or corner shape of the new structure, high wind speeds and phenomena such as the Venturi effect or passages can occur. The Venturi effect happens, for instance, when wind enters a narrow area in a built environment, resulting in a pressure drop and an increase in velocity, making the surrounding region windier.
The ways that all of these factors impact people range from discouraging customers from visiting nearby shops to posing real safety risks to pedestrians and cyclists, even threatening lives in extreme cases.
Wind comfort issues
The Flatiron Building in New York is a famous example of a structure that caused dramatic changes in wind flow. Since it opened in 1902, laws and regulations have been enhanced, with many urban authorities not granting permission for a high building without a pedestrian wind comfort study being conducted. Yet, despite the progress made on this subject, there are several cases of newly constructed buildings that have caused similar damaging effects.
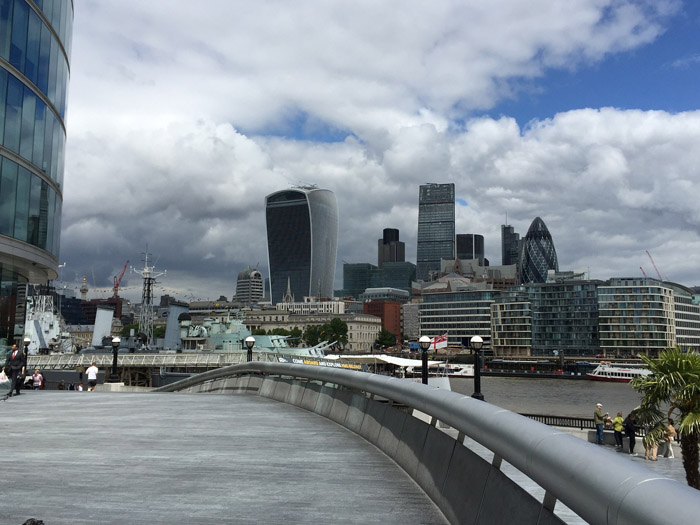
In fact, the 20 Fenchurch Street skyscraper (known as the ‘Walkie Talkie’ building) in London is a notorious case. Two years after sunlight reflected off the building was found to be so intense it scorched pavements and melted cars, the tower was accused of creating a wind tunnel with extreme gusts, posing a serious danger to people.
Cases like these are forcing authorities to reconsider construction standards and put in place stricter requirements for wind comfort assessments. Such studies take into consideration meteorological data, aerodynamics, and comfort criteria. The data regarding aerodynamics is provided by wind tunnel tests (physical experiments) and numerical simulation with computational fluid dynamics (CFD) software.
With simulation (or perhaps, more accurately, computer-aided engineering), the airflow over a building or urban area design can be modelled digitally. This approach is faster and less costly than physical wind tunnel tests but, in general, both techniques are used in combination to ensure all required data is provided and adequate testing ensured.
By assessing pedestrian wind comfort, urban master planners, civil engineers and architects can predict the behaviour of wind flow around buildings while they are in the design phase. Wind speeds and other parameters can be calculated at pedestrian levels, and comfort can be assessed based on given criteria. This allows for changes and improvements to be directly implemented into the design and iterated until the best version is created.
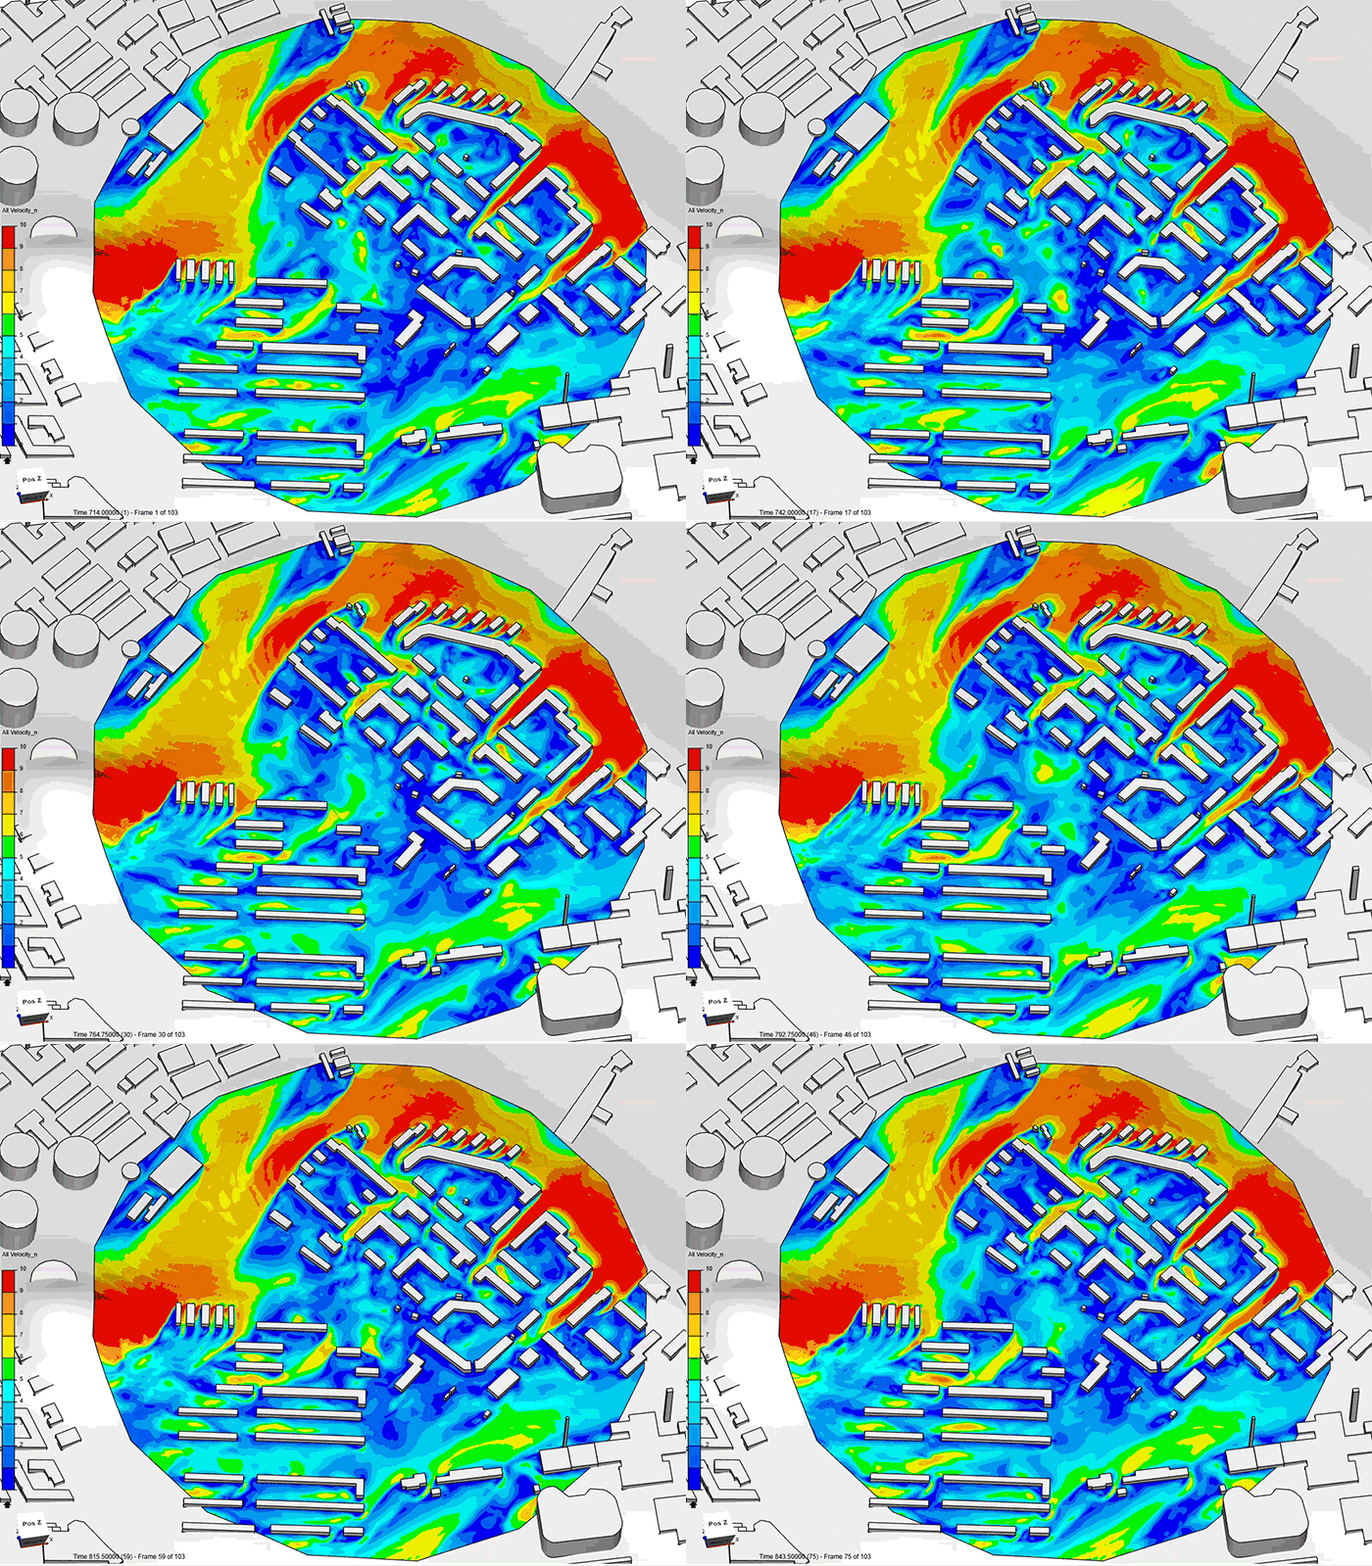
To assess the level of comfort and safety of pedestrians around the ‘Walkie Talkie’ building, we ran our own CFD simulation. The video below shows the average velocity at pedestrian head level (1.5m-2m altitude) when one wind direction is considered. These simulation results easily identified higher wind velocities around the corners of some of the buildings. This phenomenon is called ‘cornering effect’ and can have an even stronger impact when two opposite buildings are subject to it, and when the street is parallel to the wind direction. In fact, the simulation predicted this effect on the narrow streets on one of the sides of the ‘Walkie Talkie’.
The red zones represent the uncomfortable areas for pedestrians, where the wind velocity is 8m/s and above. Due to the fact that the ‘Walkie Talkie’ is tall and is surrounded by smaller structures, it redirects the airstream down, creating a downdraft flow that will increase the wind velocity at the bottom of the structure. Together with the cornering and channelling effects, this phenomenon influences pedestrian wind comfort.
As the skyscraper has already been built, the solutions that can be taken to improve the comfort of pedestrians and cyclists are limited. What the simulation results show is how much CFD technology can be used to predict design flaws or make improvements early in the process.
Case Study: Stockholm Royal Seaport
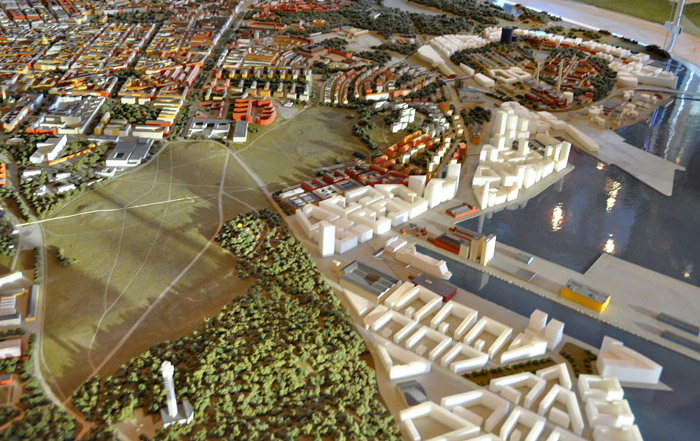
The Stockholm Royal Seaport expansion project started in the early 2000s and plans to create 12,000 new homes and 35,000 workplaces by 2030. This area in the capital of Sweden consisting of tall apartment blocks, substantial buildings exposed to semi-coastal weather conditions makes the perfect subject for a pedestrian wind comfort study.
For the study, we used our online CFD solution based on the Lattice Boltzmann method (LBM) to obtain a detailed and accurate prediction of the wind velocity at pedestrian level, using wind rose data taken from a third-party weather forecast supplier. The technology has been developed especially for pedestrian wind comfort analysis as opposed to traditional steady-state CFD analysis which has a more general use.
After uploading the CAD model into the simulation platform, selecting the areas of interest, and choosing the analysis type, the wind rose data was imported to input the correct wind inlet profile for each direction.
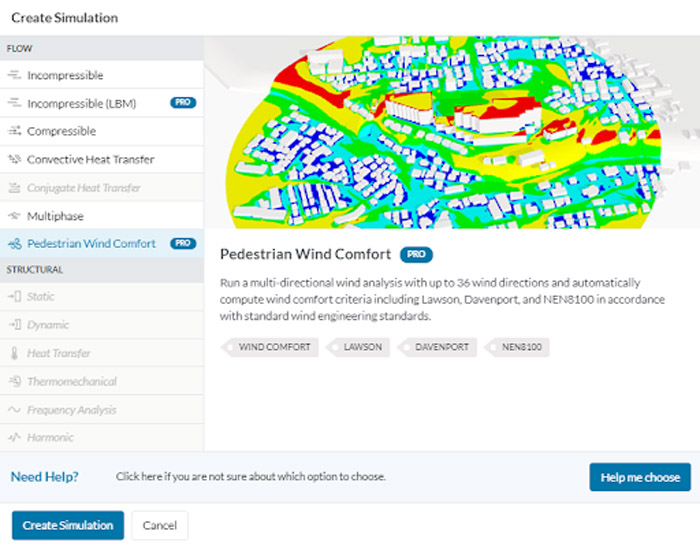
Pedestrian zones were selected at certain heights above the terrain, to match local conditions and project requirements. The simulation tool then computed the calculations in all directions (in this case, 16 directions).
A single computation, combining multiple wind directions, produced time dependent results, precisely revealing the transient wind effects such as gusts, vortex shedding, and cornering effects. Output quantities (e.g. streamlines, cutting planes, isosurfaces, and more) were visualised in both a transient and average state.
With the standard wind comfort criteria in the industry integrated, such as Lawson, Davenport, and NEN 8100, calculation results were provided from all wind directions and analysed the wind frequencies at certain velocities.
For the North-East wind direction, the simulation results showed that there is an issue with the rows of apartment blocks. The fact that they are perpendicular to the wind stream means that fluid flow between each space between the building accelerates from 8m/s to about 16m/s at times. This sort of undesired phenomenon is not uncommon in urban areas like the Stockholm Royal Seaport and it often needs to be addressed by architects, urban planners and project managers.
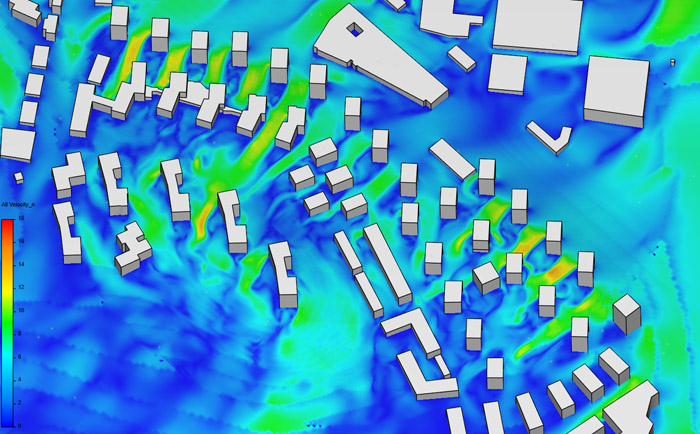
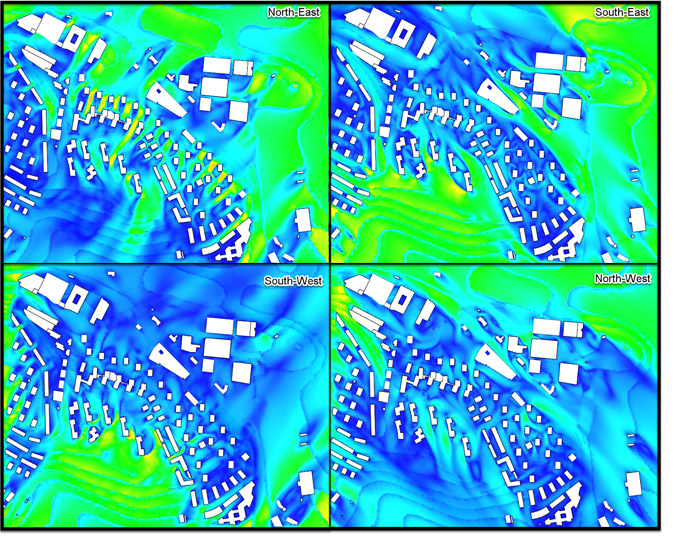
The multi wind direction study helps target the worst-case scenario and anticipate any flaws, early in the design process.
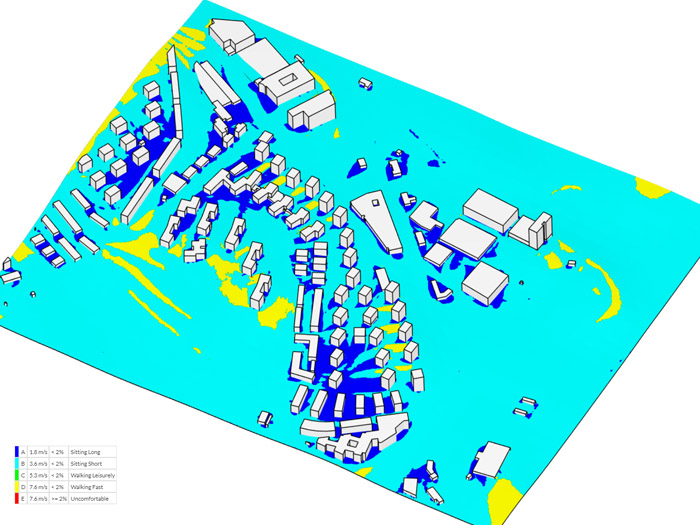
The results of all wind directions computations were combined into one set of results in order to create a heatmap showing wind comfort criterion.
The results shown by the wind comfort criteria heat map highlighted and confirmed some of the observations previously made for the North-East wind direction. Indeed, zones between the apartment blocks in the centre of the region of study were shown to be acceptable only for pedestrians walking fast. In addition, some areas directly exposed to the shore indicated strong wind intensity. This means that, in all the regions shown in yellow (or red), residents will experience discomfort if they are to stay (standing up or sitting down) in these locations. This information is very useful for urban development planners in predicting the use of streets and planning the implementation of bus stops, parks, as well as restaurant and bar terraces.
Conclusion
Pedestrian wind comfort studies are crucial in building design. Combining wind tunnel studies with CFD simulation can ensure a comprehensive testing process as well as an efficient and cost-effective way to deliver the best architecture project possible. If the results of a simulation reveal problems, flaws, or improvement potential, designs can be easily modified early in the process and re-simulated until the best CAD version is reached.
If you enjoyed this article, subscribe to our email newsletter or print / PDF magazine for FREE

