The ability to visualise 3D data is becoming increasingly important for not only architects, but engineers and planners as well. From highway design to noise impact assessment James Cutler, CEO, emapsite, looks at the many ways 3D visualisation can benefit AEC professionals.

One of the biggest challenges for architects, designers and landscapers, or for consulting engineers seeking infrastructure design in harmony with environmental and social expectations, is the difficulty in getting their conceptual ideas across to clients and potential end users. Overcoming this barrier with stunning presentations can make all the difference to the success of a proposal or project, be it landscape, equipment, infrastructure, building services or housing development.
In this article we consider some of the issues affecting the way in which CAD (and GIS) users create our future, the buildings, infrastructure and landscape of our everyday lives and how tools have evolved in very recent times to empower all stakeholders, from architects and technicians to citizens, project managers, government and service providers.
{mospagebreak}
What is 3D visualisation?
We have touched on some of these subjects and technologies in previous articles and here endeavour to focus in on the area of 3D graphics:
- Visualisation (texture mapping1, ray tracing2, lighting and photo editing)
- Animation/simulation3 (fly-by, walk-through4)
- Modelling (solid modelling, surface modelling, wireframe modelling)5
The process of creating 3D computer graphics can be divided into three basic phases:
- Content creation (3D modelling, texturing, animation)
- Scene layout setup (lighting especially but also the creation of the surface or mesh)
- Rendering
For most users in our industry the pertinent areas are content (acquisition, accuracy/utility, currency, cost) and rendering though all other elements play a part.
Where were we?
Visualisation was for the movies, for wireframe drawings and those lucky enough to have great workstations and graphics cards. And for the AEC professional the choices for context and processing werenÝt all that extensive or accurate ± users had to rely on site surveys or coarse grids and very simple rendering that was painfully slow, often took place in a separate window in the application and were disconnected from the source. Thankfully, developments in data capture and processing and convergence of technologies mean that many, including consumers, are familiar with, indeed anticipate, dynamic photo-realistic quasi-real world environments when presented with ýthe future¯.
What has changed? Virtual globes!
Nothing has changed ± CAD users have been able to do (some of) this for years. True. However, the GAYM6 virtual globes changed everything at least as far as the non-specialist was concerned, accelerating expectations across the professional workplace.
Virtual globes are Internet-based 3D software engines that display a partial or complete digital representation of Earth based on a set of geometric parameters. Terrain data such as elevation is then added to this representation as a base layer, and satellite imagery, aerial photographs (or even mapping) are draped over the model to give the user the impression of a 3D virtual globe on a 2D screen.
Common functions include zoom, tilt, rotate, moving to, querying, adding notations, and overlays. Depending on the software, some virtual globes also provide interfaces through which a user can design new tools and functionalities by modifying menu-driven or open-source applications.
Currently, many have limited capabilities to directly process spatial data and are primarily used for geographic visualisation and annotation. However, a trend is already evident combining the display features of virtual globes with powerful GIS functionality.
Each virtual globe offers different interfaces to create new and modify existing overlays. For example, TerraExplorer Pro offers tools to import data, modify data, and animate actions, while Google EarthÝs uses Keyhole Markup Language (KML), itself built on XML. Indeed, many GIS vendors now offer connectors to or export in KML to facilitate integration with and visualisation using Google Earth and other virtual globes. This is despite the fact that many of them also offer their own (usually costly) 3D extensions which may give an insight into the future of GIS (as opposed to CAD or GI)!
However, a survey of commercially available terrain visualisation software does reveal a myriad of products7, suggesting diverse needs and wide-ranging demand that exceed the glamour of the GAYM brigade.
What lies beneathÍ..
MooreÝs law accounts for the continuing acceleration in the computer processing power that enables the sometimes-amazing rendering we have witnessed for some years but there are enablers on the data capture and supply side that are germane to their every day adoption in these systems.
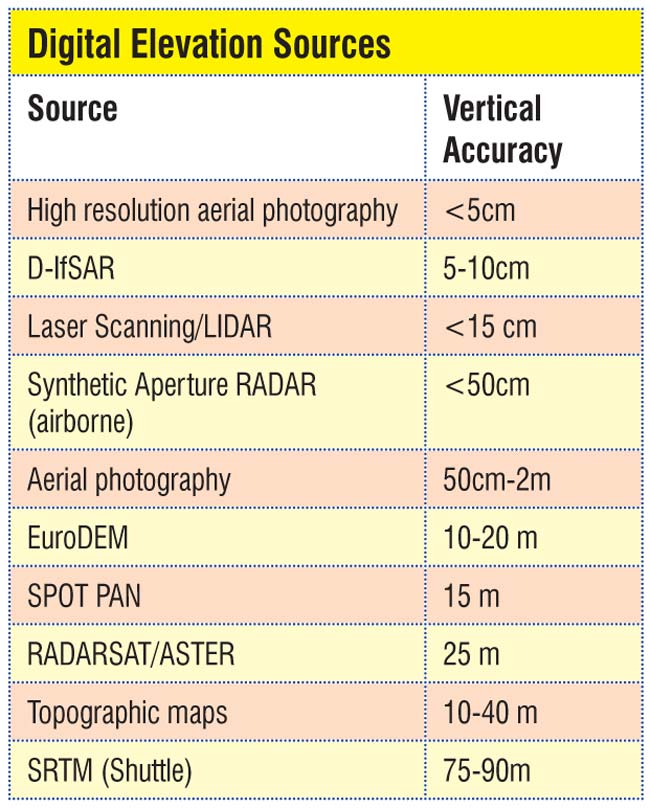
The evolution of airborne data capture techniques, notably LIDAR8 and IfSAR or even differential interferometry (D-IfSAR/InSAR)9 but also in aerial photography, that give vertical accuracy in the low 10s of cm means that high accuracy orthogonally correct three dimensional models are widely available both for urban environments and increasingly in other areas. This in turn gives confidence to technicians and project managers alike that they can cost effectively create near real world visualisations that deliver real value to the design process and to the presentation and consultation activities along the way.
{mospagebreak}

Real world integration
With OS MasterMap, now the de facto large scale map data source, it becomes straightforward to create real world models within an OS MasterMap environment. This is the operating context for our industry but the impact of GAYM has stimulated other areas which in turn have an impact on our industry:
- Education ± this is the way future consumers already see the world
- Property – prospecting
- Planning – visualise complete proposed housing estates before they have left the planning stage from the perspective of the future occupants
- Estate Agency ± sell on the same basis; 3D walkthroughs
- Defence/Security ± often leading this field now using commercial applications and widely available data for mission planning, command and control, vehicle routing and training
- Government ± local and central government are increasingly using these tools for planning activities and consultation as well as to meet e-government initiatives across a broad spectrum of requirements for citizen centric services
And what is more a new range of photographic data is becoming available that enables up to date 3D visualisation of urban environments. Technologies such as Pictometry and organisations such as the Local Data Company and Upshot provide services that augment texture mapping and ray tracing in dramatic ways.
Some recent examples
The Biggleswade bypass10 planning process brought together terrain data, aerial photography and building height information to create the initial landscape. Into this was inserted the engineering drawing of the proposed transport corridor and profile. Advanced texturing, lighting and rendering were the prerequisites for the creation of an analytical tool and the precursors to the eventual launch of a consultative/presentational tool. In the analytical stage engineers and landscapers were able to realign the vertical profile of and plan appropriate mitigation measures for the intended bypass to reduce visual and noise impacts in first floor residential accommodation along the intended corridor. This assessment and iterative design could then play a promotional as well as consultative role!
{mospagebreak}
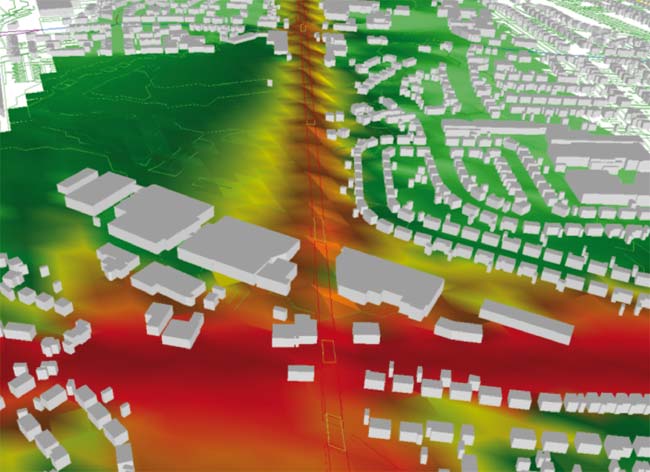
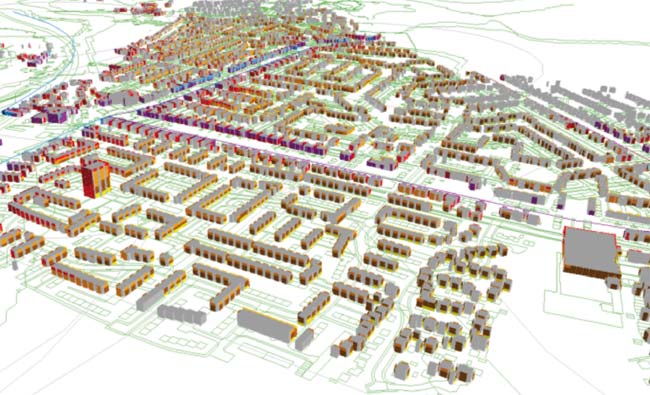
The Trafford Interchange11 is major freight interchange planned for South Manchester involving a new link road and 4.5km or re-opened railway requiring noise assessment across some 7,000 properties. Input data sets included OS MasterMap as the topographic base, OS Landform Profile 5m contours and OSCAR Traffic Manager for the transport network. 3D building height data was then appended to the OS MasterMap building features (TOIDS) where available and average heights ascribed to others so that all buildings could be extruded for noise fa?ade assessment (see Figure 1).
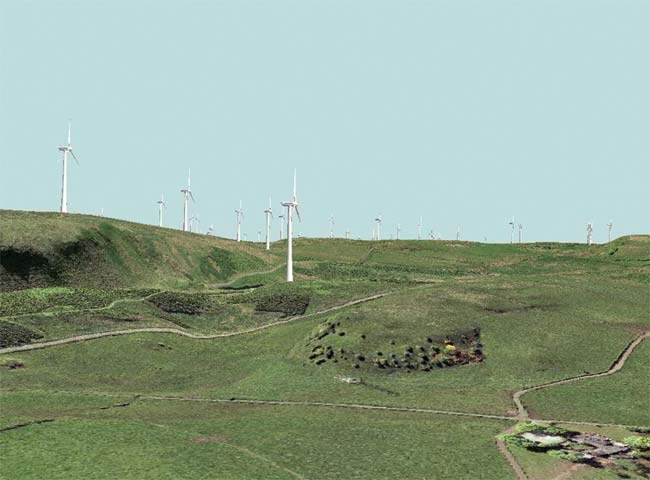
Windfarm development is another area requiring significant investment in terrain data and visualisation techniques both for energy modelling and site planning but also for visual impact assessment. Viewshed analysis and intervisibility studies (see Figure 2) are used for site selection, planning application submission, consultation and so on. Backdrop mapping, digital terrain models and aerial photography enable the creation of near real world models that clarify the development proposition to stakeholders and allow engineers to iterate turbine position in response to wind models, accessibility, surface geology and visual impact.

Summary
3D data is now of a cost, resolution and currency that allows those needing real world environments to regard 3D visualisation as a mandatory element of their projects from inception to delivery. On top of which modern surveying techniques and third party providers enable individual property level modelling, inside and out. All of which can sit within a common reference framework provided by OS MasterMap.
3D visualisation enables designers and technicians to work to clientsÝ briefs to conceive and visualise their projects, interrogate structural form, aesthetics and choice of texture and colours. 3D software can provide clash detection and co-ordinated design development, together with computer modelling from any angle, perspective generation of photo-realistic images, investigation of design alternatives, photo-fitting with existing photographs and animation of the computer model.
These tools enable our industry to provide significant benefits to our clients in providing a flexible platform for option assessment in the design and consultation process and in helping to deliver in such sensitive areas as obtaining difficult planning consents.
This article was written by James Cutler, CEO at eMapSite, a platinum partner of Ordnance Survey and online mapping service to professional users
1.A technique for simulating a large amount of surface detail by mapping images (textures) onto polygons.
2.Where mathematically-modelled visualisations of programmed scenes are produced using a technique which follows rays from the eyepoint outward, rather than originating at the light sources.
>3. Simulation: an attempt to model a real-life situation on a computer so that it can be studied to see how the system works – by changing variables, predictions may be made.
4. In AEC there is little dynamic animation; rather different perspectives can be obtained from viewing the model from different positions, hence the familiar fly-through.
5. In addition to these modelling processes modelling may include editing object surface or material properties (e.g., colour, luminosity, diffuse and specular shading components ¾ more commonly called roughness and shininess, reflection characteristics, transparency or opacity, or index of refraction), adding textures, bump-maps and other features.
6. Google, Ask, Yahoo, Microsoft ± or more specifically Google Earth, World Wind, Virtual Earth/Live Local, TerraExplorer.
7.(Back to text)) www.tec.army.mil/TD/tvd/survey/survey_toc.html.
8. LIDAR (Light Detection and Ranging; or Laser Imaging Detection and Ranging) is an optical remote sensing technology which measures properties of scattered light to find range and/or other information of a distant targe.
9. Differential interferometry (D-InSAR) requires two images plus a DEM. An interferogram (called the reference interferogram) is created from the first two images. A second interferogram is created that captures topography + distortion. Subtracting the latter from the reference interferogram can reveal differential fringes, indicating vertical ground movement such as subsidence.
10. Courtesy of Mouchel Parkman; the software used was ERDAS Imagine Virtual GIS.
11. Courtesy of Hepworth Acoustics.


