Using Frame, the Desktop-as-a-Service (DaaS) solution, we test 23 GPU-accelerated ‘instances’ from Amazon Web Services (AWS), Google Cloud Platform (GCP), and Microsoft Azure, in terms of raw performance and end user experience
If you’ve ever looked at public cloud workstations and been confused, you’re not alone. Between Amazon Web Services (AWS), Google Cloud Platform (GCP), and Microsoft Azure, there are hundreds of different instance types to choose from. They also have obscure names like g4dn.xlarge or NC16asT4v3, which look like you need a code to decipher.
Things get even more confusing when you dial down into the specs. Whereas desktop workstations for sale tend to feature the latest and greatest, cloud workstations offer a variety of modern and legacy CPU and GPU architectures that span several years. Some of the GCP instances, for example, offer Intel ‘Skylake’ CPUs that date back to 2016!
Gaining a better understanding of cloud workstations through their specs is only the first hurdle. The big question for design, engineering, and architecture firms is how each virtual machine (VM) performs with CAD, Building Information Modelling (BIM), or design visualisation software. There is very little information in the public domaain, and certainly none that compares performance and price of multiple VMs from multiple providers using real world applications and datasets, and also captures the end user experience.
So, with the help of Ruben Spruijt from Frame, the hybrid and multi-cloud Desktop-as-a-Service (DaaS) solution, and independent IT consultant, Dr. Bernhard Tritsch, getting answers to these questions is exactly what we set out to achieve in this in-depth AEC Magazine article.
There are two main aspects to testing cloud workstation VMs.
- The workstation system performance.
- The real end user experience.
The ‘system performance’ is what one might expect if your monitor, keyboard, and mouse were plugged directly into the cloud workstation. It tests the workstation as a unit – and the contribution of CPU, GPU and memory to performance.
For this we use many of the same real world application benchmarks we use to test desktop and mobile workstations in the magazine. For BIM (Autodesk Revit), for CAD (Autodesk Inventor), for real-time visualisation (Autodesk VRED Professional, Unreal Engine and Enscape), and CPU and GPU rendering (KeyShot and V-Ray).
But with cloud workstations ‘system performance’ is only one part of the story. The DaaS remote display protocol and its streaming capabilities at different resolutions, network conditions – or what happens between the cloud workstation in the datacentre and the client device – also play a critical role in the end user experience. This includes latency, which is largely governed by the distance between the public cloud datacentre and the end user, bandwidth, utilisation, packet loss, and jitter.
For end user experience testing we used EUC Score, a dedicated tool developed by Dr. Bernhard Tritsch that captures, measures, and quantifies perceived end-user experience in virtual applications and desktop environments, including Frame. More on this later.
The cloud workstations
We tested a total of 23 different public cloud workstation instances from AWS, GCP, and Microsoft Azure.
Workstation testing with real-world applications is very time intensive, so we hand-picked VMs that cover most bases in terms of CPU, memory, and GPU resources.
VMs from Microsoft Azure feature Microsoft Windows 10 22H2, while AWS and GCP use Microsoft Windows Server 2019. Both operating systems support most 3D applications, although Windows 10 has slightly better compatibility.
For consistency, all instances were orchestrated and accessed through the Frame DaaS platform using Frame Remoting Protocol 8 (FRP8) to connect the end user’s browser to VMs in any of the three public clouds.
The testing was conducted at 30 Frames Per Second (FPS) in both FHD (1,920 x 1,080) and 4K (3,840 x 2,160) resolutions. Networking scenarios tested included high bandwidth (100 Mbps) with low latency (~10ms Round Trip Time (RTT)) and low bandwidth (ranging between 4, 8, and 16 Mbps) and higher latency (50-100ms RTT) using network controlled emulation.
CPU (Central Processing Unit)
Most of the VMs feature AMD EPYC CPUs as these tend to offer better performance per core and more cores than Intel Xeon CPUs, so the public cloud providers can get more users on each of their servers to help bring down costs.
Different generations of EPYC processors are available. 3rd Gen AMD EPYC ‘Milan’ processors, for example, not only run at higher frequencies than 2nd Gen AMD EPYC ‘Rome’ processors but deliver more instructions per clock (IPC). N.B. IPC is a measure of the number of instructions a CPU can execute in a single clock cycle while the clock speed of a CPU (frequency, measured in GHz) is the number of clock cycles it can complete in one second. At time of testing, none of the cloud providers offered the new 4th Gen AMD EPYC ‘Genoa’ or ‘Sapphire Rapids’ Intel Xeon processors.
Here it is important to explain a little bit about how CPUs are virtualised in cloud workstations. A vCPU is a virtual CPU created and assigned to a VM and is different to a physical core or thread. A vCPU is an abstracted CPU core delivered by the virtualisation layer of the hypervisor on the cloud infrastructure as a service (IaaS) platform. It means physical CPU resources can be overcommitted, which allows the cloud workstation provider to assign more vCPUs than there are physical cores or threads. As a result, if everyone sharing resources from the same CPU decided to invoke a highly multi-threaded process such as ray trace rendering all at the same time, they might not get the maximum theoretical performance out of their VM.
It should also be noted that a processor can go into ‘turbo boost’ mode, which allows it to run above its base clock speed to increase performance, typically when thermal conditions allow. However, with cloud workstations, this information isn’t exposed, so the end user does not know when or if this is happening.
One should not directly compare the number of vCPUs assigned to a VM to the number of physical cores in a desktop workstation. For example, an eight-core processor in a desktop workstation not only comprises eight physical cores and eight virtual (hyper-threaded) cores for a total of 16 threads, but the user of that desktop workstation has dedicated access to that entire CPU and all its resources.
GPU (Graphics Processing Unit)
In terms of graphics, most of the public cloud instance types offer Nvidia GPUs. There are three Nvidia GPU architectures represented in this article – the oldest of which is ‘Maxwell’ (Nvidia M60), which dates back to 2015, followed by ‘Turing’ (Nvidia T4), and ‘Ampere’ (Nvidia A10). Only the Nvidia T4 and Nvidia A10 have hardware ray tracing built in, which makes them fully compatible with visualisation tools that support this physics-based rendering technique, such as KeyShot, V-Ray, Enscape, and Unreal Engine.
At time of testing, none of the major public cloud providers offered Nvidia GPUs based on the new ‘Ada Lovelace’ architecture. However, GCP has since announced new ‘G2’ VMs with the ‘Ada Lovelace’ Nvidia L4 Tensor Core GPU. Most VMs offer dedicated access to one or more GPUs, although Microsoft Azure has some VMs where the Nvidia A10 is virtualised, and users get a slice of the larger physical GPU, both in terms of processing and frame buffer memory.
AMD GPUs are also represented. Microsoft Azure has some instances where users get a slice of an AMD Radeon Instinct MI25 GPU. AWS offers dedicated access to the newer AMD Radeon Pro V520. Both AMD GPUs are relatively lowpowered and do not have hardware ray tracing built in, so should only really be considered for CAD and BIM workflows.
Storage
Storage performance can vary greatly between VMs and cloud providers. In general, CAD/BIM isn’t that sensitive to read/write performance, and neither are our benchmarks, although data and back-end services in general need to be close to the VM for best application performance.
In Azure the standard SSDs are significantly slower than the premium SSDs, so could have an impact in workflows that are I/O intensive, such as simulation (CFD), point cloud processing or video editing. GCP offers particularly fast storage with the Zonal SSD PD, which, according to Frame, is up-to three times faster than the Azure Premium SSD solution. Frame also explains that AWS with Elastic Block Storage (EBS) has ‘very solid performance’ and a good performance/price ratio using EBS GP3.
Cloud workstation regions
All three cloud providers have many regions (datacentres) around the world and most instance types are available in most regions. However, some of the newest instance types for example, such as those from Microsoft Azure with new AMD EPYC ‘Milan’ CPUs, currently have limited regional availability.
For testing, we chose regions in Europe. While the location of the region should have little bearing on our cloud workstation ‘system performance’ testing, which was largely carried out by AEC Magazine on instances in the UK (AWS) and The Netherlands (Azure/GCP), it could have a small impact on end user experience testing, which was all done by Ruben Spruijt from Frame from a single location in The Netherlands.
In general, one should always try to run virtual desktops and applications in a datacentre that is closest to the end user, resulting in low network latency and packet loss. However, firms also need to consider data management. For CAD and BIM-centric workflows in particular, it is important that all data is stored in the same datacentre as the cloud workstations, or deltas are synced between a few select datacentres using global file system technologies from companies like Panzura or Nasuni.
Pricing
For our testing and analysis purposes, we used ‘on-demand’ hourly pricing for the selected VMs, averaging list prices across all regions.
A Windows Client/Server OS licence is included in the rate, but storage costs are not. It should be noted that prices in the table below are just a guideline. Some companies may get preferential pricing from a single vendor or large discounts through multi-year contracts.
Performance testing
Our testing revolved around three key workflows commonly used by architects and designers: CAD / BIM, real-time visualisation, and ray trace rendering.
CAD/BIM
While the users and workflows for CAD and Building Information Modelling (BIM) are different, both types of software behave in similar ways.
Most CAD and BIM applications are largely single threaded, so processor frequency and IPC should be prioritised over the number of cores (although some select operations are multi-threaded, such as rendering and simulation). All tests were carried out at FHD and 4K resolution.

Autodesk Revit 2021: Revit is the number one ‘BIM authoring tool’ used by architects. For testing, we used the RFO v3 2021 benchmark, which measures three largely single-threaded CPU processes – update (updating a model from a previous version), model creation (simulating modelling workflows), export (exporting raster and vector files), plus render (CPU rendering), which is extremely multithreaded. There’s also a graphics test. All RFO benchmarks are measured in seconds, so smaller is better.
Autodesk Inventor 2023: Inventor is one of the leading mechanical CAD (MCAD) applications. For testing, we used the InvMark for Inventor benchmark by Cadac Group and TFI, which comprises several different sub tests which are either single threaded, only use a few threads concurrently, or use lots of threads, but only in short bursts. Rendering is the only test that can make use of all CPU cores. The benchmark also summarises performance by collating all single-threaded tests into a single result and all multi-threaded test into a single result. All benchmarks are given a score, where bigger is better.
Ray-trace rendering
The tools for physically-based rendering, a process that simulates how light behaves in the real world to deliver photorealistic output, have changed a lot in recent years. The compute intensive process was traditionally carried out by CPUs, but there are now more and more tools that use GPUs instead. GPUs tend to be faster, and more modern GPUs feature dedicated processors for ray tracing and AI (for ‘denoising’) to accelerate renders even more. CPUs still have the edge in terms of being able to handle larger datasets and some CPU renderers also offer better quality output. For ray trace rendering, it’s all about the time it takes to render. Higher resolution renders use more memory. For GPU rendering, 8 GB should be an absolute minimum with 16 GB or more needed for larger datasets.
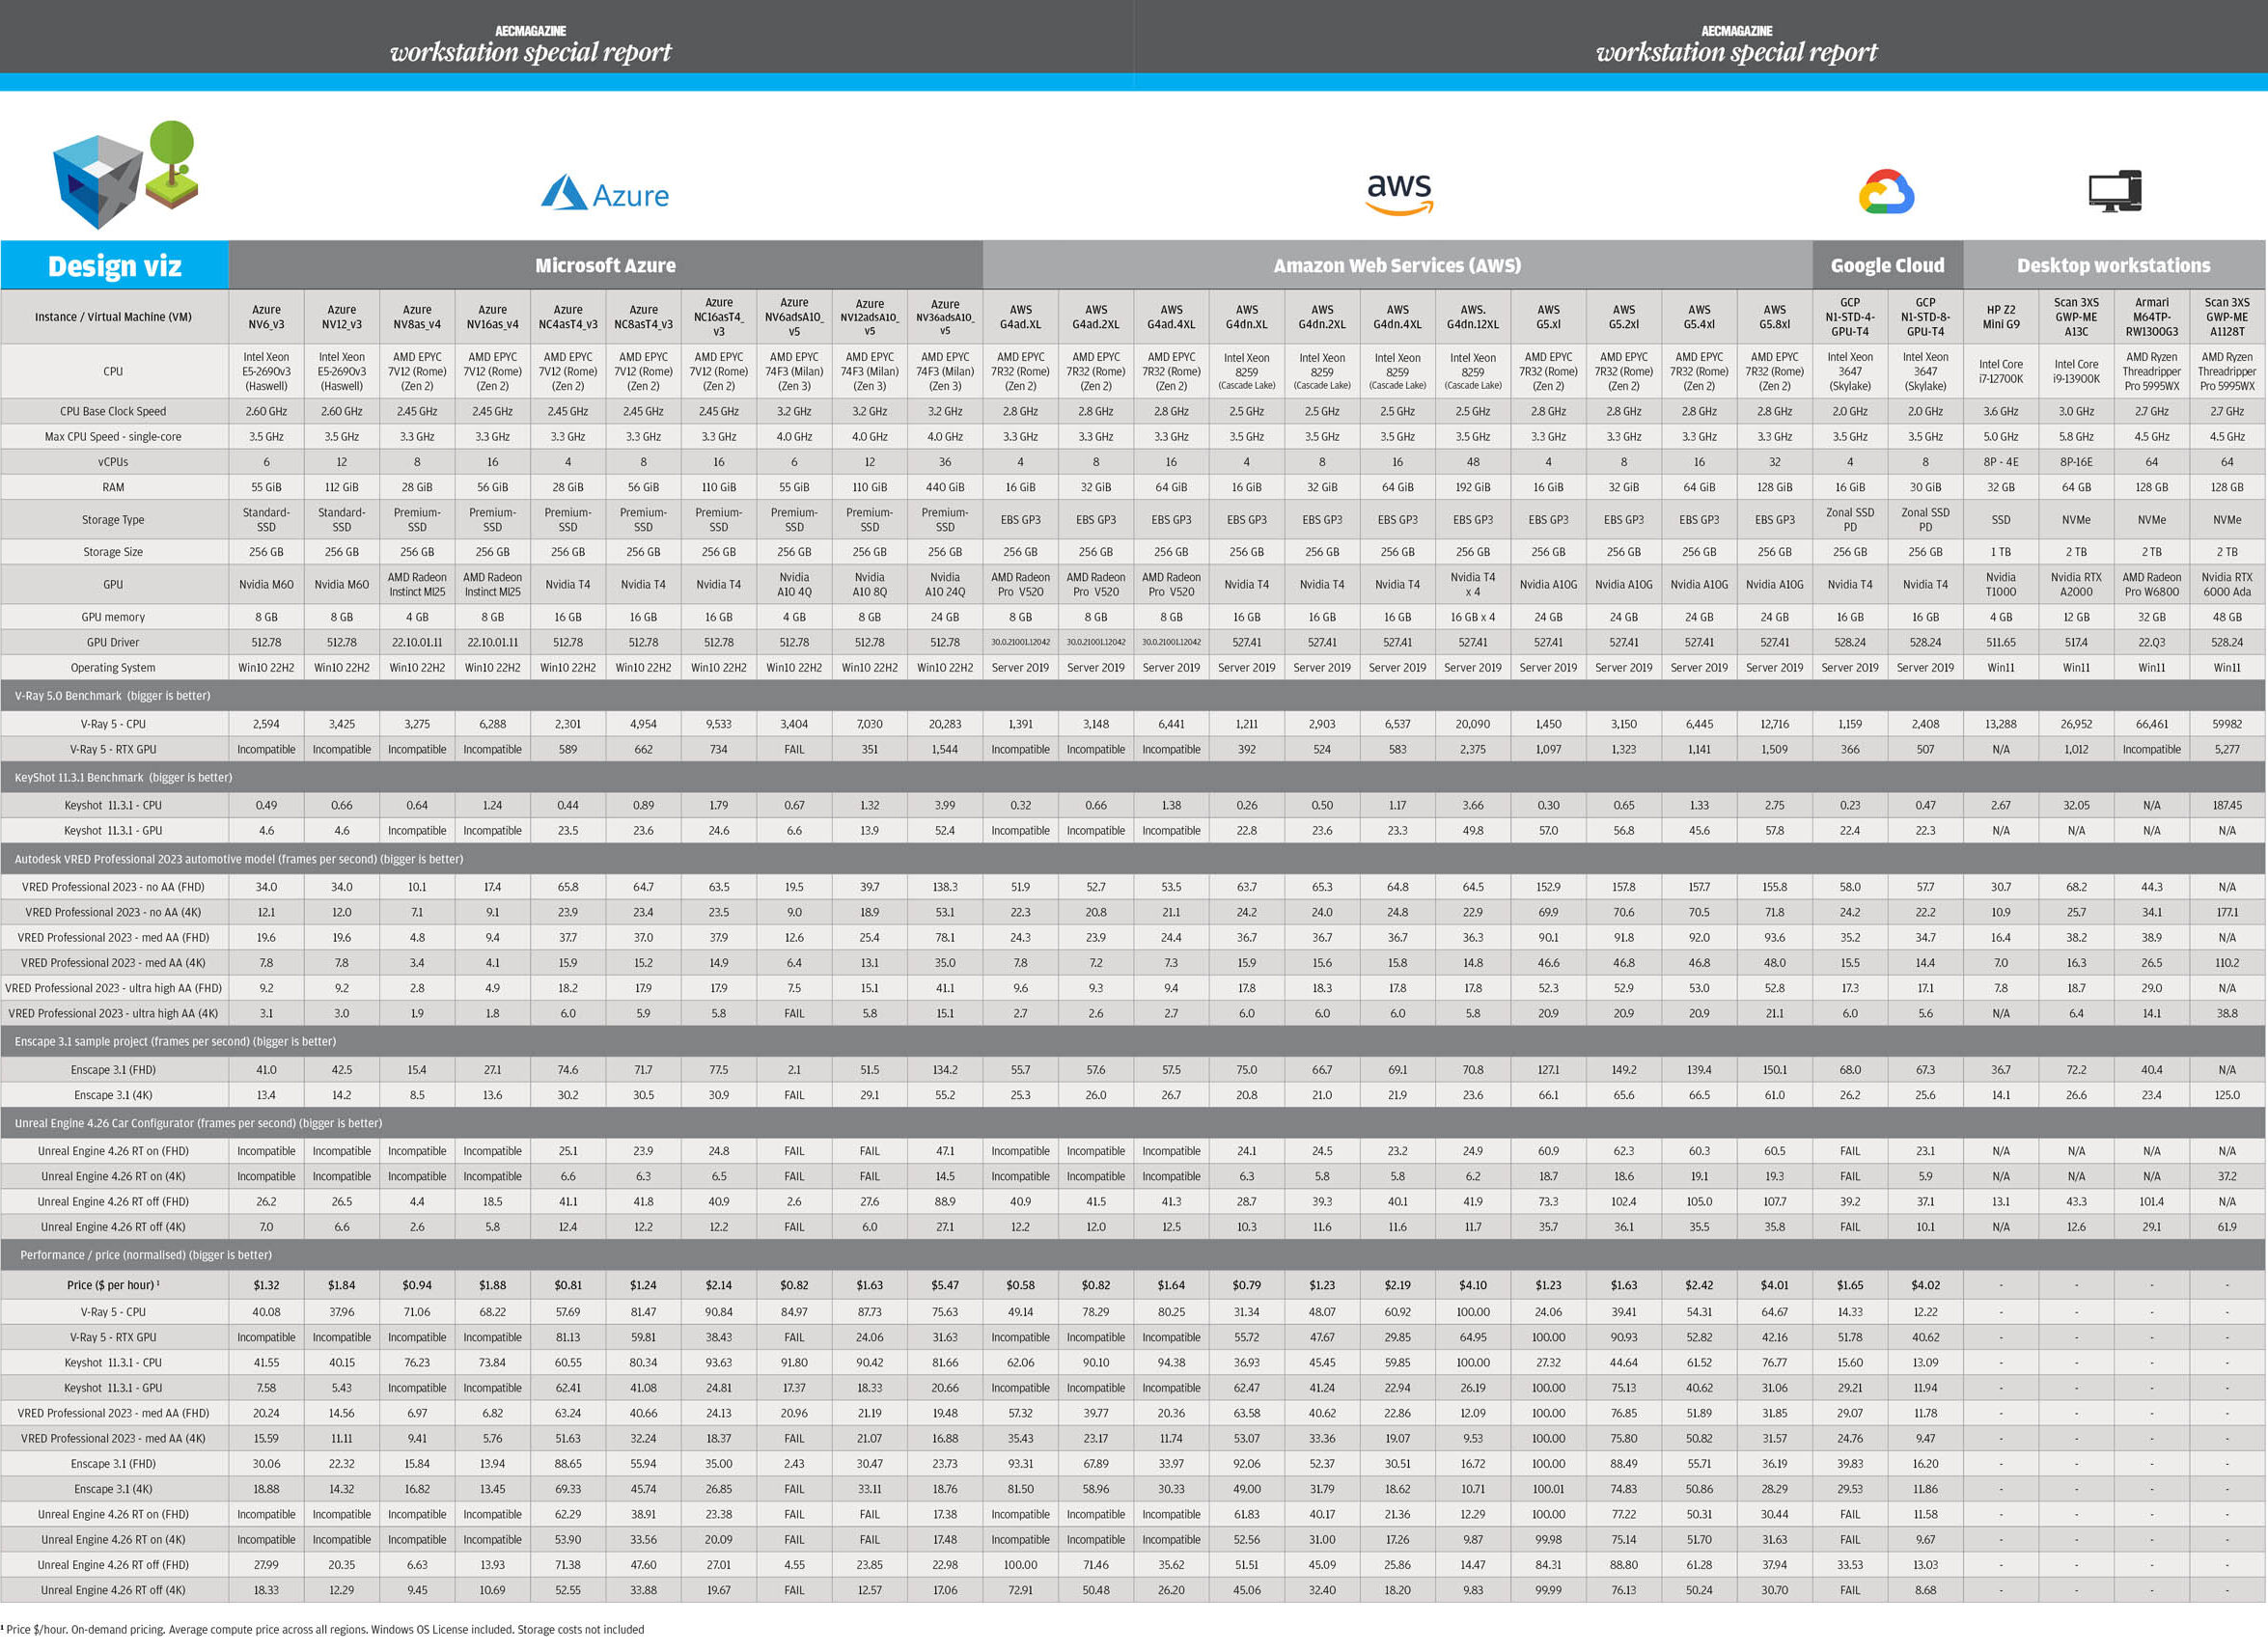
Chaos Group V-Ray: V-Ray is one of the most popular physically-based rendering tools, especially in architectural visualisation. We put the VMs through their paces using the V-Ray 5 benchmark using V-Ray GPU (Nvidia RTX) and V-Ray CPU. The software is not compatible with AMD GPUs. Bigger scores are better.

Luxion KeyShot: this CPU rendering stalwart, popular with product designers, is a relative newcomer to the world of GPU rendering. But it’s one of the slickest implementations we’ve seen, allowing users to switch between CPU and GPU rendering at the click of a button. Like V-Ray, it is currently only compatible with Nvidia GPUs and benefits from hardware ray tracing. For testing, we used the KeyShot 11 CPU and GPU benchmark, part of the free KeyShot Viewer. Bigger scores are better.
Real-time visualisation
The role of real-time visualisation in design-centric workflows continues to grow, especially among architects where tools like Enscape, Twinmotion and Lumion are used alongside Revit, Archicad, SketchUp and others. The GPU requirements for real time visualisation are much higher than they are for CAD/BIM.
Performance is typically measured in frames per second (FPS), where anything above 20 FPS is considered OK. Anything less and it can be hard to position models quickly and accurately on screen.
There’s a big benefit to working at higher resolutions. 4K reveals much more detail, but places much bigger demands on the GPU – not just in terms of graphics processing, but GPU memory as well. 8 GB should be an absolute minimum with 16 GB or more needed for larger datasets, especially at 4K resolution.
Real time visualisation relies on graphics APIs for rasterisation, a rendering method for 3D software that takes vector data and turns it into pixels (a raster image).
Some of the more modern APIs like Vulkan and DirectX 12 include real-time ray tracing. This isn’t necessarily at the same quality level as dedicated ray trace renderers like V-Ray and KeyShot, but it’s much faster. For our testing we used three relatively heavy datasets, but don’t take our FPS scores as gospel. Other datasets will be less or more demanding.
Enscape 3.1: Enscape is a real-time visualisation and VR tool for architects that uses the Vulkan graphics API and delivers very high-quality graphics in the viewport. It supports ray tracing on modern Nvidia and AMD GPUs. For our tests we focused on rasterisation only, measuring real-time performance in terms of FPS using the Enscape 3.1 sample project.

Autodesk VRED Professional 2023: VRED is an automotive-focused 3D visualisation and virtual prototyping tool. It uses OpenGL and delivers very highquality visuals in the viewport. It offers several levels of real-time anti-aliasing (AA), which is important for automotive styling, as it smooths the edges of body panels. However, AA calculations use a lot of GPU resources, both in terms of processing and memory. We tested our automotive model with AA set to ‘off’, ‘medium’, and ‘ultra-high’, recording FPS.
Unreal Engine 4.26: Over the past few years Unreal Engine has established itself as a very prominent tool for design viz, especially in architecture and automotive. It was one of the first applications to use GPU-accelerated real-time ray tracing, which it does through Microsoft DirectX Raytracing (DXR).
For benchmarking we used the Automotive Configurator from Epic Games, which features an Audi A5 convertible. The scene was tested with DXR enabled and disabled (DirectX 12 rasterisation).

Benchmark findings
For CAD and BIM
Processor frequency (GHz) is very important for performance in CAD and BIM software. However, as mentioned earlier, you can’t directly compare different processor types by frequency alone.
For example, in Revit 2021 and Inventor 2023 the 2.45 GHz AMD EPYC 7V12 – Rome (Azure NV8as_ v4) performs better than the 2.6 GHz Intel Xeon E5-2690v3 – Haswell (Azure NV6_v3 & Azure NV6_v3) because it has a more modern CPU architecture and can execute more Instructions Per Clock (IPC).
The 3.2 GHz AMD EPYC 74F3 – Milan processor offers the best of both worlds – high frequency and high IPC thanks to AMD’s Zen 3 architecture. It makes the Azure NvadsA10 v5-series (NV6adsA10_v5 / Azure NV12adsA10_v5 / Azure NV36adsA10_v5) the fastest cloud workstations for CPU-centric CAD/BIM workflows, topping our table in all the single threaded or lightly threaded Revit and Inventor tests.
Taking a closer look at the results from the Azure NvadsA10 v5-series, the entrylevel NV6adsA10_v5 VM lagged a little behind the other two in some Revit and Inventor tests. This is not just down to having fewer vCPUs – 6 versus 12 (Azure NV12adsA10_v5) and 36 (NV36adsA10_ v5). It was also slower in some singlethreaded operations. We imagine there may be a little bit of competition between the CAD software, Windows, and the graphics card driver (remember 6 vCPUs is not the same as 6 physical CPU cores, so there may not be enough vCPUs to run everything at the same time). There could also possibly be some contention from other VMs on the same server.
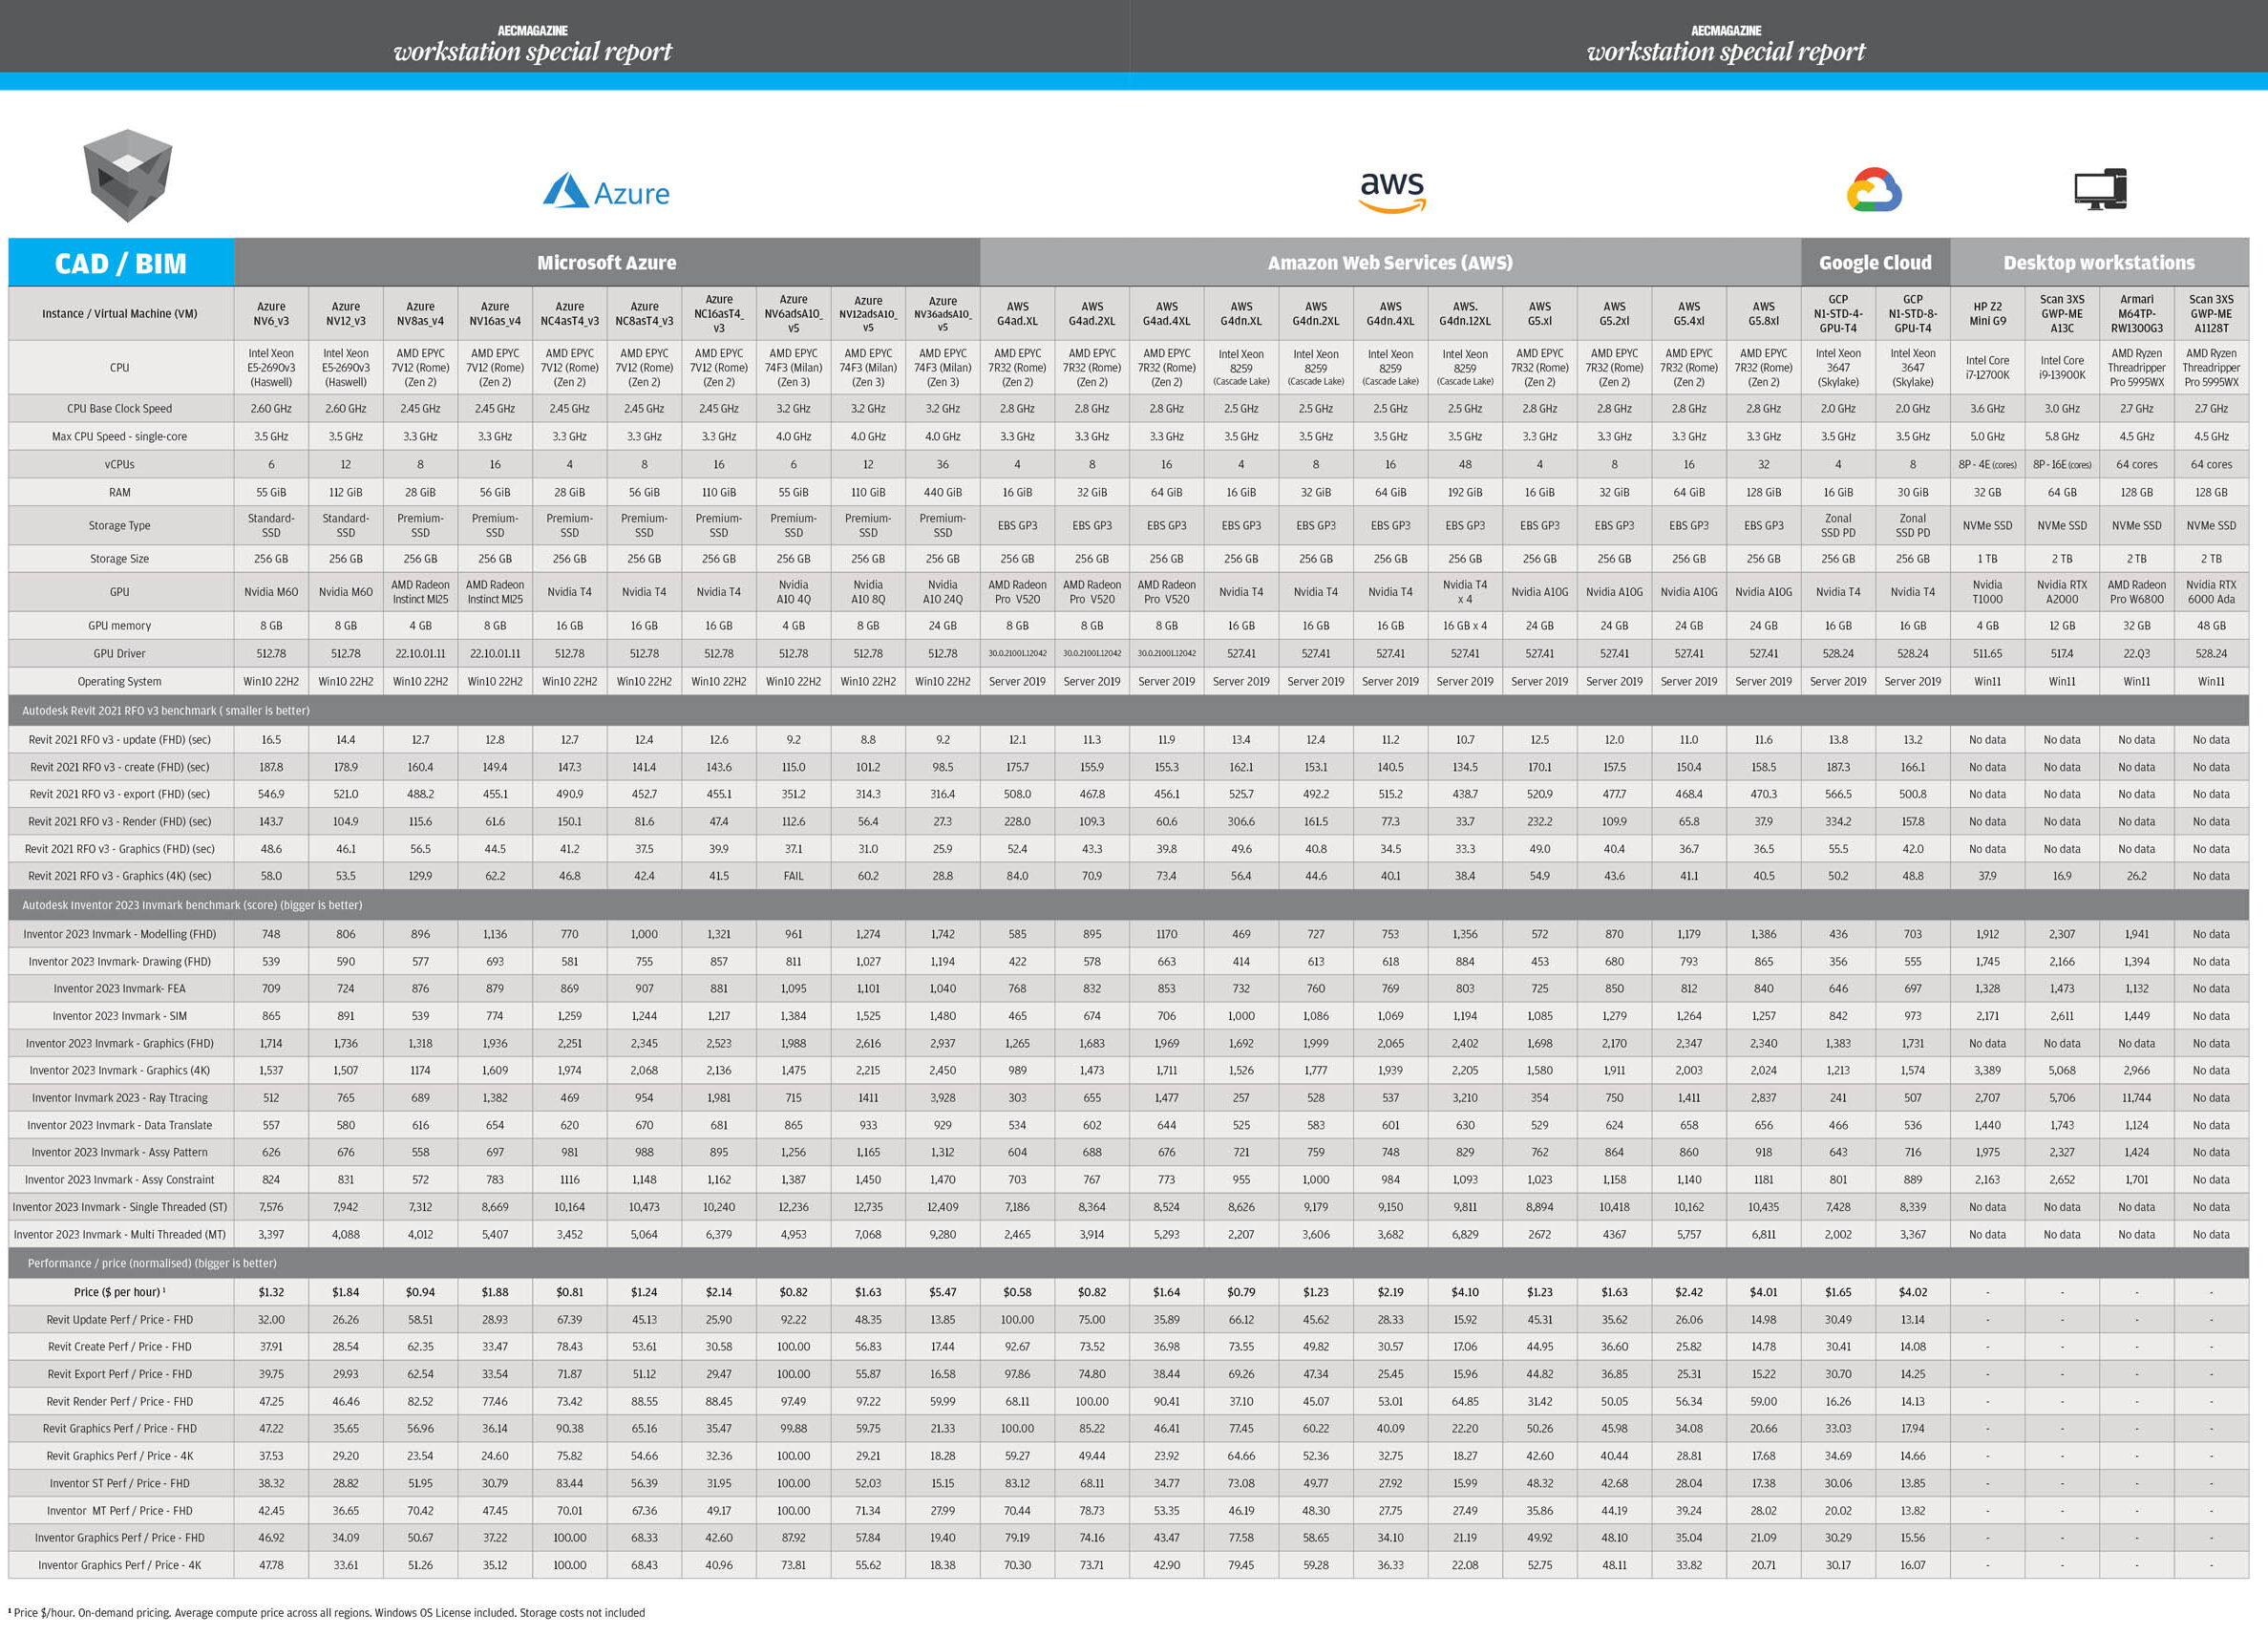
Despite this, the 6 vCPU Azure NV6adsA10_v5 instance with 55 GB of memory still looks like a good choice for some CAD and BIM workflows, especially considering its $0.82 per hour price tag.
We use the word ‘some’ here, as unfortunately it can be held back by its GPU. The Nvidia A10 4Q virtual GPU only has 4 GB of VRAM, which is less than most of the other VMs on test. This appears to limit the size of models or resolutions one can work with.
For example, while the Revit RFO v3 2021 benchmark ran fine at FHD resolution, it crashed at 4K, reporting a ‘video driver error’. We presume this crash was caused by the GPU running out of memory, as it ran fine on Azure NV12adsA10_v5, with the 8 GB Nvidia A10-8Q virtual GPU. Here, it used up to 7 GB at peak. This might seem a lot of GPU memory for a CAD/BIM application, and it certainly is. Even Revit’s Basic sample project and advanced sample project both use 3.5 GB at 4K resolution in Revit 2021. But this high GPU memory usage looks to have been addressed in more recent versions of the software. In Revit 2023, for example, the Basic sample project only uses 1.3 GB and the Advanced sample project only uses 1.2 GB.
Interestingly, this same ‘video driver error’ does not occur when running the Revit RFO v3 2021 benchmark on a desktop workstation with a 4 GB Nvidia T1000 GPU, or with Azure NV8as v4, which also has a 4 GB vGPU (1/4 of an AMD Radeon Instinct MI25). As a result, we guess it might be a specific issue with the Nvidia virtual GPU driver and how that handles shared memory for “overflow” frame buffer data when dedicated graphics memory runs out.
AWS G4ad.2xlarge looks to be another good option for CAD/BIM workflows, standing out for its price/performance. The VM’s AMD Radeon Pro V520 GPU delivers good performance at FHD resolution but slows down a little at 4K, more so in Revit, than in Inventor. It includes 8 GB of GPU memory which should be plenty to load up the most demanding CAD/BIM datasets. However, with only 32 GB of system memory, those working with the largest Revit models may need more.
As CAD/BIM is largely single threaded, there is an argument for using a 4 vCPU VM for entry-level workflows. AWS G4ad.xlarge, for example, is very cost effective at $0.58 per hour and comes with a dedicated AMD Radeon Pro V520 GPU. However, with only 16 GB of RAM it will only handle smaller models and with only 4 vCPUs expect even more competition between the CAD software, Windows and graphics card driver.
It’s important to note that throwing more graphics power at CAD or BIM software won’t necessarily increase 3D performance. This can be especially true at FHD resolution when 3D performance is often bottlenecked by the frequency of the CPU. For example, AWS G4ad.2xlarge and AWS G5.2xl both feature the same AMD EPYC 7R32 – Rome processor and have 8 vCPU. However, AWS G4ad.2xlarge features AMD Radeon Pro V520 graphics while AWS G5.2xl has the much more powerful Nvidia A10G.
At FHD resolution, the Nvidia A10G is dramatically faster than the AMD Radeon Pro V520 in viz software (more than 3 times faster in Autodesk VRED Professional, for example) but there is very little difference between the two in Revit. However, at 4K resolution in Revit, the Nvidia A10G pulls away as more demands are being placed on the GPU, thus exposing some of the potential limitations of the AMD Radeon Pro V520.
Finally, Azure NC8asT4_v3 or AWS G4dn.2xlarge could be interesting options for workflows that involve using Revit alongside visualisation applications like Enscape, Lumion and Twinmotion. We found the Nvidia T4 GPU delivered good performance in those apps at FHD resolution, but not at 4K where things slow down. However, as they both have slower CPUs, general application performance will not be as good as it is with AWS G4ad.2xlarge or Azure NV6adsA10_v5.
Visualisation with GPUs
For real-time viz, a high-performance GPU is essential, and while there are many workflows that don’t need plenty of vCPU, those serious about design visualisation often need both.
It’s easy to rule out certain VMs for real-time visualisation. Some simply don’t have sufficient graphics power to deliver anywhere near the desired 20 FPS in our tests. Others may have enough performance for FHD resolution or for workflows where real-time ray tracing is not required.
For entry-level workflows at FHD resolution, consider the Azure NV12adsA10_v5. Its Nvidia A10 8Q GPU has 8 GB of frame buffer memory which should still be enough for small to medium sized datasets displayed at FHD resolution. The Azure NV6_v3 and Azure NV12_v3 (both Nvidia M60) should also perform OK in similar workflows, but these VMs will soon be end of life. None of these VMs are suitable for GPU ray tracing.
For resolutions approaching 4K, consider VMs with the 16 GB Nvidia T4 (Azure NC4asT4_v3, Azure NC8asT4_v3, Azure NC16asT4_v3, AWS G4dn.xlarge, AWS G4dn.2xlarge, AWS G4dn.4xlarge). All of these VMs can also be considered for entry-level GPU ray tracing.
For top-end performance at 4K resolution consider VMs with the 24 GB Nvidia A10, including the AWS G5.xlarge, AWS G5.2xlarge, AWS G5.4xlarge, AWS G5.8xlarge and Azure NV36adsA10_v5. Interestingly, while all four VMs offer similar performance in V-Ray and KeyShot, the AWS instances are notably faster in real time workflows. We don’t know why this is.
The AWS.G4dn.12xlarge is also worth a mention as it is the only VM we tested that features multiple GPUs (4 x Nvidia T4). While this helps deliver more performance in GPU renderers (KeyShot and V-Ray GPU) it has no benefit for real-time viz, with VRED Professional, Unreal and Enscape only able to use one of the four GPUs.
Finally, it’s certainly worth checking out GCP’s new G2 VMs with ‘Ada Lovelace’ Nvidia L4 GPUs, which entered general availability on May 9 2023. While the Nvidia L4 is nowhere near as powerful as the Nvidia L40, it should still perform well in a range of GPU visualisation workflows, and with 24 GB of GPU memory it can handle large datasets. Frame will be testing this instance in the coming weeks.
While benchmarking helps us understand the relative performance of different VMs, it doesn’t consider what happens between the datacentre and the end user
As mentioned earlier, 3D performance for real time viz is heavily dependent on the size of your datasets. Those that work with smaller, less complex product / mechanical design assemblies or smaller / less realistic building models may find they do just fine with lower spec VMs. Conversely if you intend to visualise a city scale development or highly detailed aerospace assembly then it’s unlikely that any of the cloud workstation VMs will have enough power to cope. And this is one reason why some AEC firms that have invested in cloud workstations for CAD/BIM and BIM-centric viz workflows prefer to keep high-end desktops for their most demanding design viz users.
Visualisation with CPUs
The stand-out performers for CPU rendering are quite clear with the Azure NV36adsA10_v5 with 36 vCPU and AWS. G4dn.12xlarge with 48 vCPU delivering by far the best results in V-Ray, KeyShot and those renderers built into Revit and Inventor.
Interestingly, even though the AMD EPYC 74F3 – Milan processor in Azure NV36adsA10_v5 has 12 fewer vCPUs than the Intel Xeon 8259 – Cascade Lake in the AWS.G4dn.12xlarge it delivers better performance in some CPU rendering benchmarks due to its superior IPC. However, it also comes with a colossal 440 GB of system memory so you may be paying for resources you simply won’t use.
Of course, these high-end VMs are very expensive. Those with fewer vCPUs can also do a job but you’ll need to wait longer for renders. Alternatively, work at lower resolutions to prep a scene and offload production renders and animations to a cloud render farm.
Desktop workstation comparisons
It’s impossible to talk about cloud workstations without drawing comparisons with desktop workstations, so we’ve included results from a selection of machines we’ve reviewed over the last six months. Some of the results are quite revealing, though not that surprising (to us at least).
In short, desktop workstations can significantly outperform cloud workstations in all different workflows. This is for a few reasons.
- Desktop workstations tend to have the latest CPU and GPU technologies. 13th Gen Intel Core processors, for example, have much a higher IPC than anything available in the cloud, and Nvidia’s new ‘Ada Lovelace’ GPUs are only now starting to make an appearance in the cloud. However, these are only single slot and not as powerful as the dual slot desktop Nvidia RTX 6000 Ada Generation.
- Users of desktop workstations have access to a dedicated CPU, whereas users of cloud workstations are allocated part of a CPU, and those CPUs tend to have more cores, so they run at lower frequencies.
- Desktop workstation CPUs have much higher ‘Turbo’ potential than cloud workstation CPUs. This can make a particularly big difference in single threaded CAD applications, where the fastest desktop processors can hit frequencies of well over 5.0 GHz.
Desktop workstations can significantly outperform cloud workstations in all different workflows, but to compare them on performance alone would be missing the point entirely
Of course, to compare cloud workstations to desktop workstation on performance alone would be missing the point entirely. Cloud workstations offer AEC firms many benefits. These include global availability, simplifying and accelerating onboarding/ offboarding, the ability to scale up and down resources on-demand, centralised desktop and IT management, built-in security with no data on the end-user PC, lower CapEx costs, data resiliency, data centralisation, easier disaster recovery (DR) capability and the built in ability to work from anywhere, to name but a few. But this is the subject for a whole new article.
End user experience testing
While benchmarking helps us understand the relative performance of different VMs, it doesn’t consider what happens between the datacentre and the end user. Network conditions, such as bandwidth, latency and packet loss can have a massive impact on user experience, as can the remoting protocol, which adapts to network conditions to maintain a good user experience.
EUC Score is a dedicated tool developed by Dr. Bernhard Tritsch that captures, measures and quantifies perceived end-user experience in remote desktops and applications. By capturing the real user experience in a high-quality video on the client device of a 3D application in use, it shows what the end user is really experiencing and puts it in the context of a whole variety of telemetry data. This could be memory, GPU or CPU utilisation, remoting protocol statistics or network insights such as bandwidth, network latency or the amount of compression being applied to the video stream. The big benefit of the EUC Score Sync Player is that it brings telemetry data and the captured real user experience video together in a single environment.
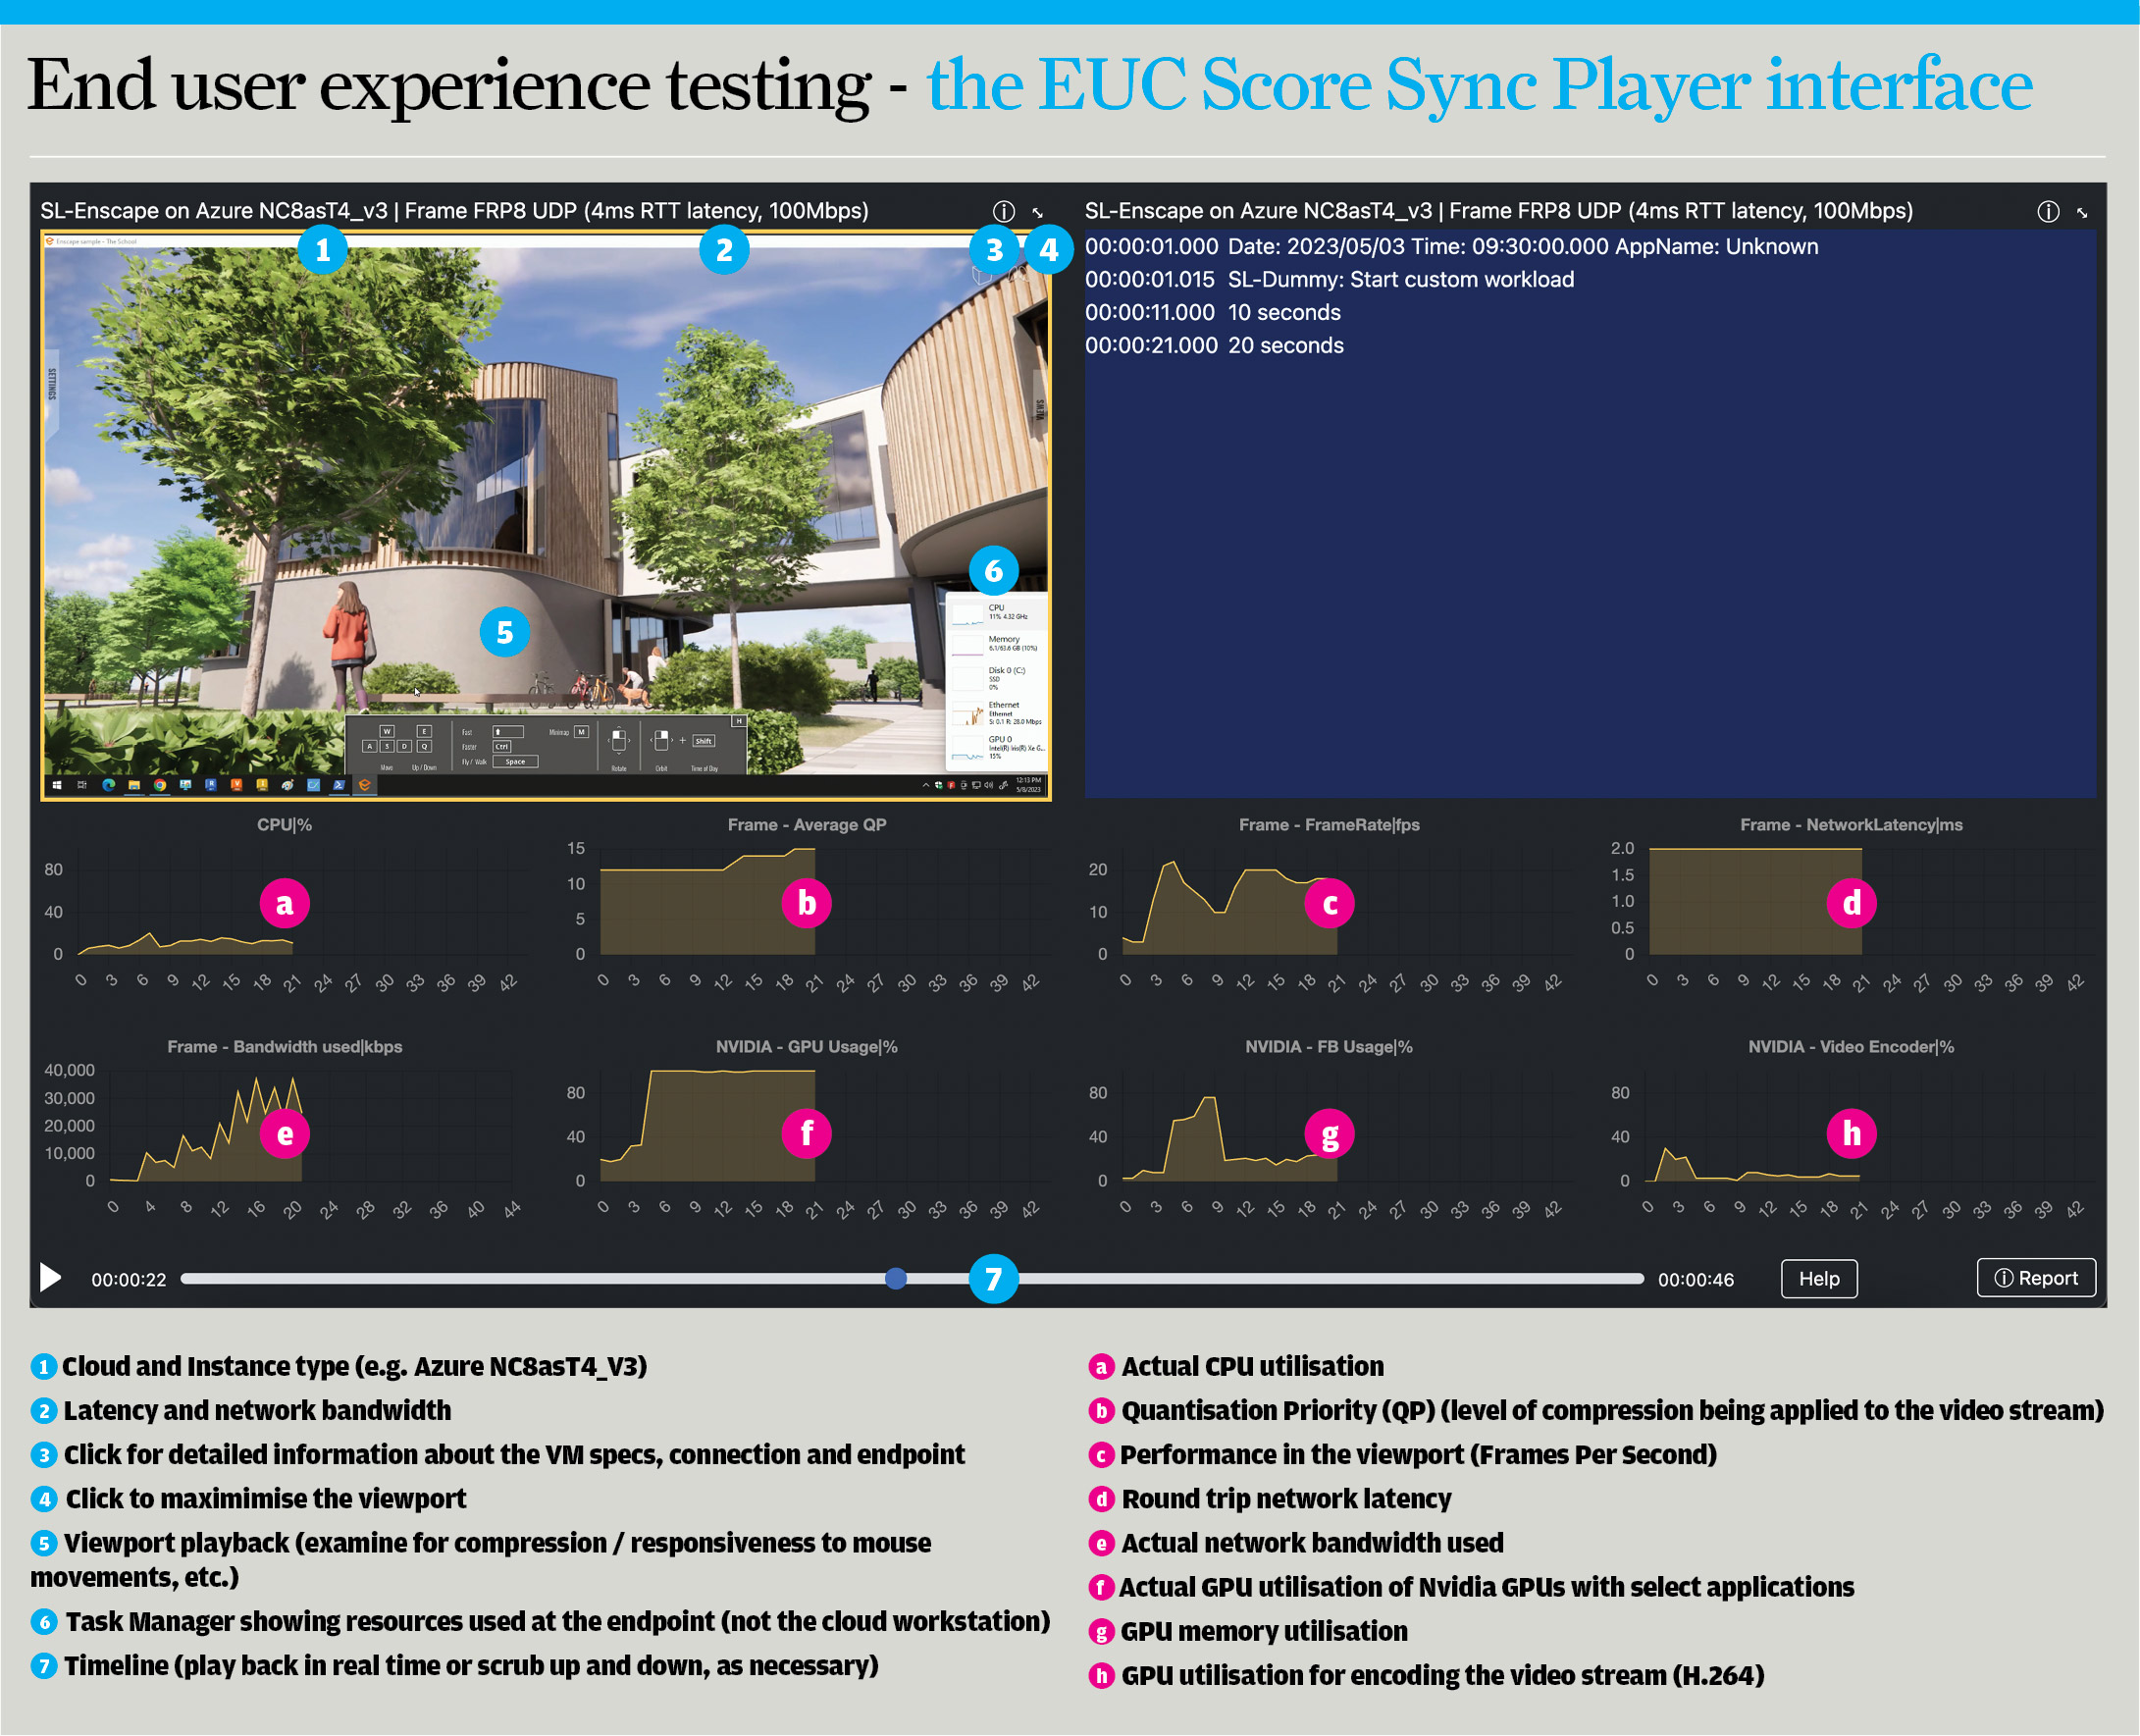
When armed with this information, IT architects and directors can get a much better understanding of the impact of different VMs / network conditions on end user experience, and size everything accordingly. In addition, if a user complains about their experience, it can help identify what’s wrong. After all, there’s no point in giving someone a more powerful VM, if it’s the network that’s causing the problem or the remoting protocol can’t deliver the best user experience.
For EUC testing, we selected a handful of different VMs from our list of 23. We tested our 3D apps at FHD and 4K resolution using a special hardware device that simulates different network conditions.
The results are best absorbed by watching the captured videos and telemetry data, which can all be seen on the Frame website.
EUC Score Sync Player is able to display eight different types of telemetry data at the same time, so that’s why there are different views of the telemetry data. The generic ‘Frame’ recordings are a good starting point, but you can also dig down into more detail in ‘CPU’ and ‘GPU’.
When watching the recordings, here are some things to look out for. Round trip latency is important and when this is high (anything over 100ms) it can take a while for the VM to respond to mouse and keyboard input and for the stream to come back. Any delay can make the system feel laggy, and hard to position 3D models quickly and accurately on screen. And, if you keep overshooting, it can have a massive impact on modelling productivity.
In low-bandwidth, higher latency conditions (anything below 8 Mbps) the video stream might need to be heavily compressed. As this compression is ‘lossy’ and not ‘lossless’ it can cause visual compression artefacts, which is not ideal for precise CAD work. In saying that, the Frame Remoting Protocol 8 (FRP8) Quality of Service engine does do a great job and resolves to full high-quality once you stop moving the 3D model around. Compression might be more apparent at 4K resolution than at FHD resolution, as there are four times as many pixels, meaning much more data to send.
Frame automatically adapts to network conditions to maintain interactivity. EUC Score not only gives you a visual reference to this compression by recording the user experience, but it quantifies the amount of compression being applied
Frame, like most graphics-optimised remoting protocols, will automatically adapt to network conditions to maintain interactivity. EUC Score not only gives you a visual reference to this compression by recording the user experience, but it also quantifies the amount of compression being applied by FRP8 to the video stream through a metric called Quantisation Priority (QP). The lower the number, the less visual compression artefacts you will see. However, the lowest you can get is 12, as to the end user this appears to be visually lossless. This highest you can get is 50 which is super blurry.


Visual compression should not be confused with Revit’s ‘simplify display during view navigation’ feature that suspends certain details and graphics effects to maintain 3D performance. In the EUC Score player you can see this in action with textures and shadows temporarily disappearing when the model is moving. In other CAD tools this is known as Level of Detail (LoD).
The recordings can also give some valuable insight into how much each application uses the GPU. Enscape and Unreal Engine, for example, utilise 100% of GPU resources so you can be certain that a more powerful GPU would boost 3D performance (in Unreal Engine, EUC Score records this with a special Nvidia GPU usage counter).
Meanwhile, GPU utilisation in Revit and Inventor is lower, so if your graphics performance is poor or you want to turn off LoD you may be better off with a CPU with a higher frequency or better IPC than a more powerful GPU.
To help find your way around the EUC Score interface, see Figure 1 above. In Figures 2 and 3 we show the impact of network bandwidth on visual compression artefacts. This could be a firm that does not have sufficient bandwidth to support tens, hundreds, or thousands of cloud workstation users or when the kids come home from school, and they all start streaming Netflix.
EUC Score test results
View the captured videos and telemetry data recordings on the Frame website.
Conclusion
If you’re an AEC firm looking into public cloud workstations for CAD, BIM or design visualisation, we hope this article has given you a good starting point for your own internal testing, something we’d always strongly recommend.
There is no one size fits all for cloud workstations and some of the instances we’ve tested make no sense for certain workflows, especially at 4K resolution. This isn’t just about applications. While it’s important to understand the demands of different tools, dataset complexity and size can also have a massive impact on performance, especially with 3D graphics at 4K resolution. What’s good for one firm, certainly might not be good for another.
Also be aware that some of the public cloud VMs are much older than others. If you consider that firms typically upgrade their desktop workstations every 3 to 5 years, a few are positively ancient. The great news about the cloud is that you can change VMs whenever you like. New machines come online, and prices change, as do your applications and workflows. But unlike desktops, you’re not stuck with a purchasing decision.
While AEC firms will always be under pressure to drive down costs, performance is essential. A slow workstation can have a massive negative impact on productivity and morale, even worse if it crashes. Make sure you test, test and test again, using data from your own real-world projects.
For more details, insights or advice, feel free to contact to Ruben Spruijt or Bernhard Tritsch.
What is Frame? The Desktop-as-a-Service (DaaS) solution
Frame is a browser-first, hybrid and multi-cloud, Desktop-as-a-Service (DaaS) solution.
Frame utilises its own proprietary remoting protocol, based on WebRTC/H.264, which is well-suited to handling graphics-intensive workloads such as 3D CAD.
With Frame, firms can deliver their Windows ‘office productivity’, videoconferencing, and high-performance 3D graphics applications to users on any device with just a web browser – no client or plug-in required.
The Frame protocol delivers audio and video streams from the VM, and keyboard / mouse events from the end user’s device. It supports up to 4K resolution, up to 60 Frames Per Second (FPS), and up to four monitors, as well as peripherals including the 3Dconnexion SpaceMouse, which is popular with CAD users.
Frame provides firms with flexibility as the platform supports deployments natively in AWS, Microsoft Azure, and GCP as well as on-premise on Nutanix hyperconverged infrastructure (HCI).
Over 100 public cloud regions and 70 instance types are supported today, including a wide range of GPUaccelerated instances (Nvidia and AMD).
Everything is handled through a single management console and, in true cloud fashion, it’s elastic, so firms can automatically provision and de-provision capacity on-demand.
This article is part of AEC Magazine’s Workstation Special report
Scroll down to read and subscribe here
Featuring
-
- Battle of the desktop workstation CPUs: Intel ‘Sapphire Rapids’ vs AMD Threadripper Pro
- Lenovo ThinkStation P7 / PX desktop workstation reviews
- ‘Sapphire Rapids’ workstation round-up – Dell, HP, BOXX, Scan and Workstation Specialists
- Nvidia RTX 6000 Ada Generation professional GPU review
- AMD Radeon Pro W7800 / W7900 professional GPUs preview
- Reimagining the desktop workstation as a remote resource
- The flexible workstation – supporting the hybrid workforce
- Sustainable cloud workstations

